
Changing interest rate expectations impact markets at the start of the year
Key Observations
- Markets were mixed in January, with U.S. large cap equities leading the way while non-U.S. equities and fixed income produced lackluster returns.
- Market sentiment shifted and optimism on the potential for a soft-landing grew. Expectations for a Federal Reserve rate cut early in 2024 shifted significantly over the course of the month to later in the year.
- Economic data has delivered above expectations of late, but potential headwinds remain and preparing for rather than predicting a downturn remains prudent.
Market Recap
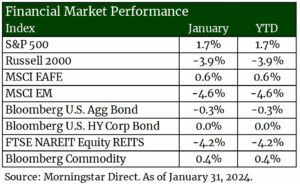
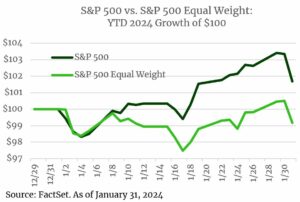
The New Year began with mixed results across asset classes. Growing optimism around the potential for a soft-landing, expectations on central bank policy, and turmoil in the Red Sea all had an impact on returns. Large cap domestic equities were the winner in January, with the S&P 500 returning 1.7%. The “Magnificent 7” once again helped push the top-heavy S&P 500 Index higher, accounting for over 20% of the return for the month1 and exacerbated the dispersion between the S&P 500’s equal weighted sibling (see chart below). Small cap stocks struggled, with negative returns across almost every sector within the index. Despite the tailwind of more favorable economic conditions, the shift in interest rate expectations was the main drag on the small cap space as investors lowered their outlook for the first rate cut to happen in March.
Abroad, both developed and emerging market equity markets struggled. The U.S. economy continues to grow while neighbors across the pond remain flat. Growth in the European Union was flat in the fourth quarter of 2023, resulting in 0.5% growth for calendar year 2023 across the EU, according to the “first estimate”.2 The developed market focused MSCI EAFE Index gained a modest 0.6% in the first month of the year. In addition to lackluster economic growth, ongoing conflict between Ukraine and Russia and rising tensions in the Middle East and the Red Sea weighed on investor sentiment. Emerging markets, as measured by the MSCI EM Index, returned -4.6%. China, which accounts for over 25% of the benchmark3, continues to be a primary detractor with the country declining 10.6% in January. Anemic economic conditions along with the continued struggle for a debt laden property sector have weighed on investor sentiment. The Chinese government though has not sat idle and has continued to ease lending standards and begun stimulus measures to support economic growth in hopes of restoring animal spirts in markets.
Bond markets took a step back from the strong rally seen in the fourth quarter of 2023, with the Bloomberg U.S. Aggregate Index falling 0.3%. Growing optimism for a soft-landing, shifting expectations for a March interest rate cut, and the heavy issuance calendar of longer dated paper drove the repricing in the fixed income market. The corporate high yield market was flat in the month. The sector is less-interest rate sensitive than the broader market (i.e., lower duration) and spreads ultimately ended the quarter close to where they began.
Diversifying areas of the market such as commodities and REITs struggled as well. The Bloomberg Commodity Index produced a slight positive return (+0.4%). Falling precious metal prices, particularly gold, was a headwind. However higher energy prices helped buoy the asset class as conflict in the Red Sea grew and oil prices rose. REITs traded down on the shift in expectations for rate cuts later in the year after having returned over 16% in Q4 2023 as rate expectations fell. Lower rates reduce lending costs for properties owners, which would be a welcome sign of relief for a market historically reliant on higher levels of debt.
Investor Optimism Growing but Should Still Be Cautious
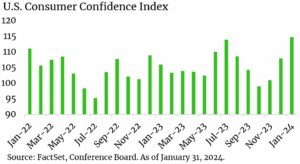
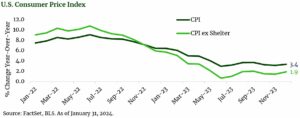
Investor optimism surrounding a soft-landing grew in January. Consumer confidence saw a large jump in the month and now sits at the highest level in the last two years. Not surprisingly, this has coincided with relatively resilient economic data and positive market returns. The U.S. economy showed continued growth in the fourth quarter 2023 as the “advance GDP” estimate reported 3.3%; a strong number, but a sharp drop from the almost 5% growth in the third quarter of last year.4 Much of the growth was due to an increase in consumer spending. Inflation, which has been at or near the top of key metrics investors have been watching, continues to moderate. The broadest measure of inflation, U.S. Consumer Price Index (CPI), has trended significantly lower since the start of 2023 and now sits at 3.4% as of December 2023, the most recent reading. While still hovering above the Fed’s 2% target, if we remove the shelter component, which has been persistently high over the past two years, inflation has been at or below 2% since June 2023.5
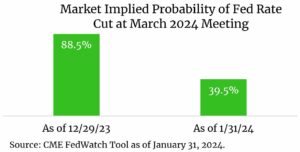
Heading into the end of 2023, investor expectations were widely bullish on a Federal Reserve rate cut in March 2024. However, the resilience of the U.S. economy and favorable data being reported in recent weeks has seen those expectations shift significantly. While moderating inflation has set the stage for potential cuts in the future, the strong economy has softened the expectation. Markets were pricing an over 80% probability of a Fed cut in March as of the end of 2023, and that shifted to just a 40% probability at the end of January. This shift in expectations had a large impact on markets in the month, as discussed above.
Economic data has certainly been better than expectations in recent months, but it does not mean we are in the clear and have avoided a recession all together. Signals, such as negative leading indicators, still restrictive central bank policy and unemployment, while still low, has moved above its 12-month moving average. Additionally, we are seeing signs from the corporate sector that the outlook may not be all rosy. While only a limited number of companies in the S&P 500 have issued earnings guidance for Q1, over half have been negative.6 As we highlighted in our 2024 outlook, Goldilocks and the Three Risks to Consensus, we remain grounded and recognize that economic contractions are a normal course of the market cycle. The market is pricing in a greater than 50% chance that the Fed’s target rate will be over 100 bps lower than the current level by year-end7, implying investors do in fact see the need for potential central bank action to help support the economy.
Outlook
The investment themes that we outlined in our 2024 Outlook remain in the wake of mixed market performance in January: the “goldilocks” backdrop requires preparation not the accurate prediction of a recession, the path to 2% inflation remains highly uncertain and will likely be bumpy, and understanding the impact of monetary and fiscal policy changes in an election year remains prudent. The pronounced continued outperformance and concentration in U.S. large cap has created imbalances and introduced concentration risk that need to be monitored closely and managed through diversification. The anticipated path to lower interest rates, in our view, fails to adequately reflect the possibility of rates remaining higher for longer given the uncertainty of inflation. And as election headlines dominate daily news, doing the hard work to understand, what if any investment implications could be forthcoming, remains a component of proper risk management in this historic election year.
Endnotes:
- Morningstar Direct. As of January 31, 2024. Magnificent 7 stocks are Amazon, Apple, Alphabet, Meta, Microsoft, NVIDIA, Tesla
- As of January 31, 2024.
- As of January 31, 2024.
- As of January 25, 2024
- As of January 31, 2024
- FactSet, Earnings Insights, January 26, 2024
- CME FedWatch Tool. As of January 30, 2024.
Disclosures & Definitions
Comparisons to any indices referenced herein are for illustrative purposes only and are not meant to imply that actual returns or volatility will be similar to the indices. Indices cannot be invested in directly. Unmanaged index returns assume reinvestment of any and all distributions and do not reflect our fees or expenses.
- The S&P 500 is a capitalization-weighted index designed to measure performance of the broad domestic economy through changes in the aggregate market value of 500 stocks representing all major industries.
- The S&P 500 Equal Weight Index (EWI) is the equal-weight version of the widely-used S&P 500. The index includes the same constituents as the capitalization weighted S&P 500, but each company in the S&P 500 EWI is allocated a fixed weight – or 0.2% of the index total at each quarterly rebalance.
- Russell 2000 consists of the 2,000 smallest U.S. companies in the Russell 3000 index.
- MSCI EAFE is an equity index which captures large and mid-cap representation across Developed Markets countries around the world, excluding the U.S. and Canada. The index covers approximately 85% of the free float-adjusted market capitalization in each country.
- MSCI Emerging Markets captures large and mid-cap representation across Emerging Markets countries. The index covers approximately 85% of the free-float adjusted market capitalization in each country.
- Bloomberg U.S. Aggregate Index covers the U.S. investment grade fixed rate bond market, with index components for government and corporate securities, mortgage pass-through securities, and asset-backed securities.
- Bloomberg U.S. Corporate High Yield Index covers the universe of fixed rate, non-investment grade debt. Eurobonds and debt issues from countries designated as emerging markets (sovereign rating of Baa1/BBB+/BBB+ and below using the middle of Moody’s, S&P, and Fitch) are excluded, but Canadian and global bonds (SEC registered) of issuers in non-EMG countries are included.
- FTSE NAREIT Equity REITs Index contains all Equity REITs not designed as Timber REITs or Infrastructure REITs.
- Bloomberg Commodity Index is calculated on an excess return basis and reflects commodity futures price movements. The index rebalances annually weighted 2/3 by trading volume and 1/3 by world production and weight-caps are applied at the commodity, sector and group level for diversification.
Material Risks
- Fixed Income securities are subject to interest rate risks, the risk of default and liquidity risk. U.S. investors exposed to non-U.S. fixed income may also be subject to currency risk and fluctuations.
- Cash may be subject to the loss of principal and over longer periods of time may lose purchasing power due to inflation.
- Domestic Equity can be volatile. The rise or fall in prices take place for a number of reasons including, but not limited to changes to underlying company conditions, sector or industry factors, or other macro events. These may happen quickly and unpredictably.
- International Equity can be volatile. The rise or fall in prices take place for a number of reasons including, but not limited to changes to underlying company conditions, sector or industry impacts, or other macro events. These may happen quickly and unpredictably. International equity allocations may also be impact by currency and/or country specific risks which may result in lower liquidity in some markets.
- Real Assets can be volatile and may include asset segments that may have greater volatility than investment in traditional equity securities. Such volatility could be influenced by a myriad of factors including, but not limited to overall market volatility, changes in interest rates, political and regulatory developments, or other exogenous events like weather or natural disaster.
- Private Real Estate involves higher risk and is suitable only for sophisticated investors. Real estate assets can be volatile and may include unique risks to the asset class like leverage and/or industry, sector or geographical concentration. Declines in real estate value may take place for a number of reasons including, but are not limited to economic conditions, change in condition of the underlying property or defaults by the borrow.
Investment advisory services offered through Thrivent Advisor Network, LLC., a registered investment adviser and a subsidiary of Thrivent. Advisory Persons of Thrivent provide advisory services under a “doing business as” name or may have their own legal business entities. However, advisory services are engaged exclusively through Thrivent Advisor Network, LLC, a registered investment adviser. Cedar Cove Wealth Partners and Thrivent Advisor Network, LLC are not affiliated companies. Information in this message is for the intended recipient[s] only. Please visit our website www.cedarcovewealth.com disclosures.
The material presented includes information and opinions provided by a party not related to Thrivent Advisor Network. It has been obtained from sources deemed reliable; but no independent verification has been made, nor is its accuracy or completeness guaranteed. The opinions expressed may not necessarily represent those of Thrivent Advisor Network or its affiliates. They are provided solely for information purposes and are not to be construed as solicitations or offers to buy or sell any products, securities, or services. They also do not include all fees or expenses that may be incurred by investing in specific products. Past performance is no guarantee of future results. Investments will fluctuate and when redeemed may be worth more or less than when originally invested. You cannot invest directly in an index. The opinions expressed are subject to change as subsequent conditions vary. Thrivent Advisor Network and its affiliates accept no liability for loss or damage of any kind arising from the use of this information.
Any specific securities identified and described do not represent all of the securities purchased, sold, or recommended for advisory clients. The reader should not assume that investments in the securities identified and discussed were or will be profitable. A summary description of the principal risks of investing in a particular model is available upon request. There can be no assurance that a model will achieve its investment objectives. Investment strategies employed by the advisor in selecting investments for the model portfolio may not result in an increase in the value of your investment or in overall performance equal to other investments. The model portfolio’s investment objectives may be changed at any time without prior notice. Portfolio allocations are based on a model portfolio, which may not be suitable for all investors. Clients should also consider the transactions costs and/or tax consequences that might result from rebalancing a model portfolio. Frequent rebalancing may incur additional costs and/or tax consequences versus less rebalancing. Please notify us if there have been any changes to your financial situation or your investment objectives, or if you would like to place or modify any reasonable restrictions on the management of your account.
This communication may include forward-looking statements. Specific forward-looking statements can be identified by the fact that they do not relate strictly to historical or current facts and include, without limitation, words such as “may,” “will,” “expects,” “believes,” “anticipates,” “plans,” “estimates,” “projects,” “targets,” “forecasts,” “seeks,” “could’” or the negative of such terms or other variations on such terms or comparable terminology. These statements are not guarantees of future performance and involve risks, uncertainties, assumptions and other factors that are difficult to predict and that could cause actual results to differ materially.
Index Benchmarks presented within this report may not reflect factors relevant for your portfolio or your unique risks, goals or investment objectives. Past performance of an index is not an indication or guarantee of future results. It is not possible to invest directly in an index.
The Bloomberg Magnificent 7 Total Return Index is an equal-dollar weighted equity benchmark consisting of a fixed basket of 7 widely-traded companies classified in the United States and representing the Communications, Consumer Discretionary and Technology sectors as defined by Bloomberg Industry Classification System.
The Consumer Price Index (CPI) is a measure of the average change over time in the prices paid by urban consumers for a market basket of consumer goods and services.
The Bureau of Economic Analysis (BEA) is an agency of the Department of Commerce that produces economic accounts statistics that enable government and business decision-makers, researchers, and the American public to follow and understand the performance of the nation’s economy. To do this, BEA collects source data, conducts research and analysis, develops and implements estimation methodologies, and disseminates statistics to the public.
The Bureau of Labor Statistics (BLS) is an agency of the United States Department of Labor. It is the principal fact-finding agency in the broad field of labor economics and statistics and serves as part of the U.S. Federal Statistical System. BLS collects, calculates, analyzes, and publishes data essential to the public, employers, researchers, and government organizations.
The CME FedWatch Tool is a tool created by the CME Group (Chicago Mercantile Exchange Group) to act as a barometer for the market’s expectation of potential changes to the fed funds target rate while assessing potential Fed movements around Federal Open Market Committee (FOMC) meetings.
The Federal Open Market Committee (FOMC) is the branch of the Federal Reserve System that determines the direction of monetary policy. The FOMC has 12 voting members, including all seven members of the Board of Governors and a rotating group of five Reserve Bank presidents. The Chair of the Board of Governors also serves as Chair of the FOMC.
Gross domestic product (GDP) is the total monetary or market value of all the finished goods and services produced within a country’s borders in a specific time period. As a broad measure of overall domestic production, it functions as a comprehensive scorecard of a given country’s economic health.
A real estate investment trust (REIT) is a company that owns, operates, or finances income-generating real estate.
Securities offered through Purshe Kaplan Sterling Investments (“PKS”), Member FINRA/SIPC. PKS is headquartered at 80 State Street, Albany, NY 12207. PKS and Cedar Cove Wealth Partners are not affiliated companies.
