
Market Commentary
The S&P 500 rose by 10.2% in the first quarter, marking its strongest start since 2019 and one of the best since 1926. The strong performance continued to broaden with all eleven U.S. sectors finishing higher. Non-U.S. developed markets (1) posted a +5.7% return in dollar terms while emerging markets (2) rose 2.4%. International exposures were hindered by an appreciating US dollar which rose 3.2%. (3) Bonds did not participate in the equity rally as investors repriced expectations regarding when the initial fed funds rate cut would occur and how many cuts were likely this year, causing yields to surge across issues and maturities. The Bloomberg U.S. Aggregate fell by -0.8% due to persistent inflation and resilient economic growth that favored the outlook for stocks.
Market Considerations
Our outlook centers around the three most likely scenarios to unfold based on the present environment. Our highest conviction, base case scenario is a “no landing”; an environment that is likely to see the economy overheat, running above potential, with inflation remaining above the Fed’s long-term target of two percent. Our second highest conviction is a “hard landing”, likely driven by a Fed policy misstep that requires significant easing to curb an unexpected slowdown in economic activity, characterized by rising unemployment and falling prices. A “soft landing”, the goldilocks of monetary policy outcomes, would be characterized by inflation gradually declining toward two percent with the economy growing near its long-term potential. We will explore the investment implications of each scenario and our updated portfolio allocations that reflect an inability to predict, but an opportunity to prepare.
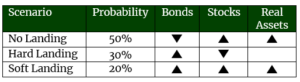
No Landing Scenario (50%)
An economy that is overheating, fighting sticky inflation, and facing a tight job market has historically exhibited late cycle characteristics. During a late cycle, commodities tend to rally, capital intensive value stocks gain pricing power, and bonds struggle as yields rise. These dynamics will allow the Federal Reserve to focus on its inflation mandate, keeping interest rates higher for longer. Late cycles tend to end abruptly, which necessitates close monitoring.
Equities: Despite investor rate cut expectations falling from six or more this past December to just two presently (4), US equities have defied gravity and rallied more than 10% to start the year. Robust earnings expectations and current price multiples provide a narrow path for material upside surprises this earnings season to stoke further appreciation, while higher rates and sticky inflation may usher in a period of multiple compression. Under this scenario, cyclically sensitive large cap value US and international developed stocks are likely to play a leading role.
Bonds: Shorter duration should outperform longer duration bonds in this scenario as a higher neutral rate (r*) and greater inflation premium is priced into bonds. The occurrence of longer rates rising faster than short term rates, known as a ‘bear steepener’, would negatively impact broad bond benchmarks. Credit spreads would likely remain tight, supported by a strong economy and low defaults, making the carry from higher yielding investments attractive relative to government bonds. Sticky inflation will likely reduce bonds’ contributions to total returns.
Real Assets: Real assets are at all-time lows relative to financial assets dating back to 1925. (5) Broad real assets, including commodities, infrastructure, and precious metals, are likely to benefit from under investment, geopolitical risks, and persistent inflation.
Hard Landing Scenario (30%)
Sticky inflation will likely leave monetary policy restrictive for too long, causing something meaningful to break, either in financial markets or the underlying economy. Quantitative tightening (QT) is another monetary policy tool we are monitoring carefully given its role in reducing liquidity, as is the shrinking demand for primary offerings of Treasuries and the related fiscal impact tied to ballooning debt servicing costs. We also anticipate that consumer spending will weaken as excess savings dwindle, though the exact timing is difficult to estimate, and spending remains supported by a stable job market. If something breaks, equities are likely to decline and long duration fixed income bonds would benefit from an accelerated Fed easing cycle. Real asset performance would likely be mixed with dividend paying assets (real estate, infrastructure, etc.) strengthening but commodity demand waning; global nuances, and cyclical and policy differences would drive underlying economic sensitivities.
Soft Landing Scenario (20%)
There is a lack of consensus on whether the Fed has ever successfully delivered a soft landing, but no matter how it is defined, occurrences range from non-existent to rare. Our expectations are in line with history. Conceptually, falling prices tend to be indicative of excess supply or weakening demand, the persistence of either weighing on economic activity. While it is possible that this time is different, the blunt tools required to execute monetary policy are likely to repeat rather than define history. However, should inflation gradually decline, and economic growth stabilize equities, bonds, and real assets would all be expected to benefit, led by small caps and growth stocks.
Conclusion
We cannot know precisely which of these scenarios will manifest or when. However, thoughtfully considering the investment implications of each scenario demonstrates prudent preparation; preparation that is reflected in our latest asset allocation recommendations. We can and should adjust our portfolios along a risk continuum to reflect our highest convictions, while expressing humility and recognizing that the outcome is likely to be determined by an unknowable variable. As Mark Twain once said, “it ain’t what you don’t know that gets you into trouble. It’s what you know for sure that just ain’t so.”
Disclosures:
This material is provided for informational purposes only and is not solely intended to be relied upon as a forecast, research or investment advice, and is not a recommendation, offer or solicitation to buy or sell any securities or to adopt and investment strategy. The views and strategies described may not be suitable for all investors. They also do not include all fees or expenses that may be incurred by investing in specific products. Past performance is not guarantee of future results. Investments will fluctuate and when redeemed may be worth more or less than when originally invested. You cannot invest directly in an index. The opinions expressed are subject to change as subsequent conditions vary. Advisory services offered through Thrivent Advisor Network, LLC.
This communication may include forward-looking statements. Specific forward-looking statements can be identified by the fact that they do not relate strictly to historical or current facts and include, without limitation, words such as “may,” “will,” “expects,” “believes,” “anticipates,” “plans,” “estimates,” “projects,” “targets,” “forecasts,” “seeks,” “could’” or the negative of such terms or other variations on such terms or comparable terminology. These statements are not guarantees of future performance and involve risks, uncertainties, assumptions, and other factors that are difficult to predict and that could cause actual results to differ materially.
Investment advisory services offered through Thrivent Advisor Network, LLC., (herein referred to as “Thrivent”), a registered investment adviser. Clients will separately engage an unaffiliated broker-dealer or custodian to safeguard their investment advisory assets. Review the Thrivent Advisor Network Financial Planning and Consulting Services, Investment Management Services (Non-Wrap) and Wrap-Fee Program brochures (Form ADV Part 2A and 2A Appendix 1 brochures) for a full description of services, fees and expenses, available at Thriventadvisornetwork.com. Thrivent Advisor Network, LLC financial advisors may also be registered representatives of a broker-dealer to offer securities products.
Advisory Persons of Thrivent provide advisory services under a “doing business as” name or may have their own legal business entities. However, advisory services are engaged exclusively through Thrivent Advisor Network, LLC, a registered investment adviser. Cedar Cove Wealth Partners and Thrivent Advisor Network, LLC are not affiliated companies.
Securities offered through Purshe Kaplan Sterling Investments (“PKS”), Member FINRA/SIPC. PKS is headquartered at 80 State Street, Albany, NY 12207. PKS and Cedar Cove Wealth Partners are not affiliated companies.
Index Benchmarks presented within this report may not reflect factors relevant for your portfolio or your unique risks, goals or investment objectives. Past performance of an index is not an indication or guarantee of future results. It is not possible to invest directly in an index.
The Standard & Poor’s 500 (S&P 500) is a market-cap weighted index comprised of the common stocks of 500 leading companies in leading industries of the U.S. economy. You cannot invest directly in an index.
The MSCI EAFE® (Morgan Stanley Capital International Europe, Australasia, and the Far East) Index is a broad market index of stocks located within countries in Europe, Australasia, and the Middle East.
The MSCI (Morgan Stanley Capital International) Emerging Markets® Index is a selection of stocks that is designed to track the financial performance of key companies in fast-growing nations.
The U.S. Dollar Index – known as USDX, DXY, DX and USD Index – is a measure of the value of the United States Dollar (USD) against a weighted basket of currencies used by U.S. trade partners. The index will rise if the Dollar strengthens against these currencies and fall if it weakens.
The CME FedWatch Tool is a tool created by the CME Group (Chicago Mercantile Exchange Group) to act as a barometer for the market’s expectation of potential changes to the fed funds target rate while assessing potential Fed movements around Federal Open Market Committee (FOMC) meetings.
(1) Source: Morningstar Direct: MSCI EAFE NR USD Index rose 5.78% from 1/1/2024 – 3/31/2024
(2) Source: Morningstar Direct: MSCI EM NR USD Index rose 2.37% from 1/1/2024 – 3/31/2024
(3) Source: Morningstar Direct: USD from 1/1/2024-3/31/2024; The US Dollar Index measures the value of the US Dollar relative to a basket of foreign currencies.
(4) CME Fed Watch probabilities for the 12/18/2024 Fed meeting placed a 4.6% probability on 4 cuts, 18.5% on three cuts, 35.1% probability on two cuts, and 41.3% probability on one or no cuts when the meeting concludes.
(5) Bank of America Global Investment Strategy, “The Flow Show: It’s such a fine line”. Hartnett, Michael. Sept. 29, 2023.
