
January 2023 Market Review
Market Recap
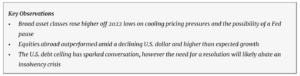
Broad asset classes kicked off the new year higher after a less than stellar December. Sentiment turned decidedly positive based on slowing wage and job growth and cooling price pressures. These trends provided optimism for a less hawkish Fed pushing investor expectations from a 0.50% Fed move in February to a 0.25% as of January 31, 2023 (1). Optimism was tempered as investors assess how the economy is weathering higher interest rates, with retail sales and producer pricing showing signs of slowing in the U.S. economy. While these appear to be signs the Fed’s fight against inflation may be working, investors continue to weigh the economic cost and viability of a “soft landing” scenario.
Fixed income markets saw a bright start to the year after a muted December, with the 10-year U.S. Treasury yield dropping 35 basis points (bps) as investor demand increased largely on more attractive yields. The yield curve remained inverted with the 10-year Treasury 68 bps below the two year. Lower quality, high yield bonds outperformed investment grade as sentiment turned positive.
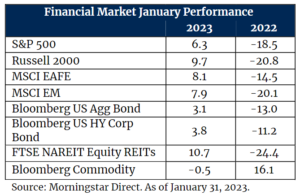
The S&P 500 returned 6.3% with domestic winners coming from small caps (+9.7%) and growth-oriented securities (+8.4%) (2). Higher interest rates in 2022 had a material influence on high-growth businesses like the technology sector which lagged many other parts of the market. A more moderate Fed helped fuel their bounce back and the technology-heavy NASDAQ marked its best start to the year since 2001 up 10.7% (3). Non-U.S. equities rose in the month and widely outpaced their domestic counterparts with tailwinds from a declining U.S. dollar, higher than expected growth in Europe and positive sentiment around China easing restrictions on zero-COVID policies.
Diversifying and inflation sensitive areas of the market such as REITs and commodities were bifurcated in performance, with REITs rallying from 2022 lows and a warmer winter in Europe dragging energy prices and commodities slightly lower.
The Debt Ceiling Distraction
Historically this budgeting statute has been more procedural than material. However, recent rising debt-to-GDP levels and partisan politics turned procedure into brinksmanship; and similar standoffs in 2011 and 2013 resulted in market volatility. In all, we believe manufactured crises like these are more noise than signal when it comes to a sound investment strategy. In our recent blog post, The Debt Ceiling Distraction, we unpack why we believe this may be an issue that grows over time, but ultimately is resolved without creating lasting systematic issues.
Outlook
Fresh off our 2023 Outlook, we believe elevated volatility, moderating inflation and markets finding a bottom following the 2022 route will be key factors to position portfolios in 2023. Headline CPI data in December gave us a fresh look into moderating inflation. While year-over-year inflation grew at 6.5%, annualized inflation over the last six months was just 0.34% providing optimism for a soft landing and the Fed moderating their hawkish stance (4). It is perhaps too early to claim victory on price stability, however, these are steps in the right direction. As for what inflation and higher rates are doing to company earnings, those impacts are just coming to the surface with the majority of fourth quarter 2022 earnings data being released in February. The barrage of layoff headlines in sectors most impacted in the recent pullback may be an early signal of what is to come from the final quarter of 2022. This incremental information continues to support our positioning of building greater resiliency in portfolios while positioning for upside potential.
For more information, please contact any of the professionals at Cedar Cove Wealth Partners.
Footnotes
- CME Group Feb 1 Fed Target Probabilities, January 31, 2023
- Morningstar: NASDAQ 100 as of January 31, 2023
- Morningstar: Russell 3000 Growth as of January 31, 2023
- Bureau of Labor Statistics as of December 31, 2023.
Disclosures and Definitions
Comparisons to any indices referenced herein are for illustrative purposes only and are not meant to imply that actual returns or volatility will be similar to the indices. Indices cannot be invested in directly. Unmanaged index returns assume reinvestment of any and all distributions and do not reflect our fees or expenses.
- The S&P 500 is a capitalization-weighted index designed to measure performance of the broad domestic economy through changes in the aggregate market value of 500 stocks representing all major industries.
- Russell 2000 consists of the 2,000 smallest U.S. companies in the Russell 3000 index.
- MSCI EAFE is an equity index which captures large and mid-cap representation across Developed Markets countries around the world, excluding the U.S. and Canada. The index covers approximately 85% of the free float-adjusted market capitalization in each country.
- MSCI Emerging Markets captures large and mid-cap representation across Emerging Markets countries. The index covers approximately 85% of the free-float adjusted market capitalization in each country.
- Bloomberg U.S. Aggregate Index covers the U.S. investment grade fixed rate bond market, with index components for government and corporate securities, mortgage pass-through securities, and asset-backed securities.
- Bloomberg U.S. Corporate High Yield Index covers the universe of fixed rate, non-investment grade debt. Eurobonds and debt issues from countries designated as emerging markets (sovereign rating of Baa1/BBB+/BBB+ and below using the middle of Moody’s, S&P, and Fitch) are excluded, but Canadian and global bonds (SEC registered) of issuers in non-EMG countries are included.
- FTSE NAREIT Equity REITs Index contains all Equity REITs not designed as Timber REITs or Infrastructure REITs.
- Bloomberg Commodity Index is calculated on an excess return basis and reflects commodity futures price movements. The index rebalances annually weighted 2/3 by trading volume and 1/3 by world production and weight-caps are applied at the commodity, sector and group level for diversification.
This material is provided for informational purposes only and is not solely intended to be relied upon as a forecast, research or investment advice, and is not a recommendation, offer or solicitation to buy or sell any securities or to adopt any investment strategy. The views and strategies described may not be suitable for all investors. They also do not include all fees or expenses that may be incurred by investing in specific products. Past performance is no guarantee of future results. Investments will fluctuate and when redeemed may be worth more or less than when originally invested. You cannot invest directly in an index. The opinions expressed are subject to change as subsequent conditions vary. Advisory services offered through Thrivent Advisor Network, LLC.
This communication may include forward looking statements. Specific forward-looking statements can be identified by the fact that they do not relate strictly to historical or current facts and include, without limitation, words such as “may,” “will,” “expects,” “believes,” “anticipates,” “plans,” “estimates,” “projects,” “targets,” “forecasts,” “seeks,” “could’” or the negative of such terms or other variations on such terms or comparable terminology. These statements are not guarantees of future performance and involve risks, uncertainties, assumptions and other factors that are difficult to predict and that could cause actual results to differ materially.
The material presented includes information and opinions provided by a party not related to Thrivent Advisor Network. It has been obtained from sources deemed reliable; but no independent verification has been made, nor is its accuracy or completeness guaranteed. The opinions expressed may not necessarily represent those of Thrivent Advisor Network or its affiliates. They are provided solely for information purposes and are not to be construed as solicitations or offers to buy or sell any products, securities, or services. They also do not include all fees or expenses that may be incurred by investing in specific products. Past performance is no guarantee of future results. Investments will fluctuate and when redeemed may be worth more or less than when originally invested. You cannot invest directly in an index. The opinions expressed are subject to change as subsequent conditions vary. Thrivent Advisor Network and its affiliates accept no liability for loss or damage of any kind arising from the use of this information.
Investment advisory services offered through Thrivent Advisor Network, LLC., (herein referred to as “Thrivent”), a registered investment adviser. Clients will separately engage an unaffiliated broker-dealer or custodian to safeguard their investment advisory assets. Review the Thrivent Advisor Network Financial Planning and Consulting Services, Investment Management Services (Non-Wrap) and Wrap-Fee Program brochures (Form ADV Part 2A and 2A Appendix 1 brochures) for a full description of services, fees and expenses, available at Thriventadvisornetwork.com. Thrivent Advisor Network, LLC financial advisors may also be registered representatives of a broker-dealer to offer securities products.
Certain Thrivent Advisor Network LLC advisors may also be registered representatives of a broker-dealer to offer securities products. Advisory Persons of Thrivent provide advisory services under a “doing business as” name or may have their own legal business entities. However, advisory services are engaged exclusively through Thrivent Advisor Network, LLC, a registered investment adviser. Please visit our website www.thriventadvisornetwork.com for important disclosures.
The opinions expressed are subject to change as subsequent conditions vary. Reliance upon information in this material is at the sole discretion of the reader. International investing involves additional risks, including risks related to foreign currency, limited liquidity, government regulation and the possibility of substantial volatility due to adverse political, economic or other developments. The two main risks related to fixed income investing are interest rate risk and credit risk. Typically, when interest rates rise, there is a corresponding decline in the market value of bonds. Credit risk refers to the possibility that the issuer of the bond will not be able to make principal and interest payments. Index performance is shown for illustrative purposes only.
Advisory Persons of Thrivent provide advisory services under a “doing business as” name or may have their own legal business entities. However, advisory services are engaged exclusively through Thrivent Advisor Network, LLC, a registered investment adviser. Cedar Cove Wealth Partners and Thrivent Advisor Network, LLC are not affiliated companies. Information in this message is for the intended recipient[s] only. Please visit our website www.cedarcovewealth.com for important disclosures.
Securities offered through Purshe Kaplan Sterling Investments (“PKS”), Member FINRA/SIPC. PKS is headquartered at 80 State Street, Albany, NY 12207. PKS and Cedar Cove Wealth Partners are not affiliated companies.
