
Breaking up with TINA (There is No Alternative), onto TARA (There are Reasonable Alternatives)
Our investment views are based on a simple idea: as facts change, so may our outlook. The last few years have been an interesting period for this ethos as our annual outlook is beginning to feel like a game of ping-pong, oscillating between bulls and bears, as the environment shifts around us. Our 2021 outlook, Poised for Growth, discussed optimism as the proverbial economic doors swung open as COVID eased. Navigating Moderation, our 2022 outlook, moved in the other direction, calling for volatile markets based on (among other factors) persistent inflation, the Fed stepping on the economic brakes and market valuations and expectations set for perfection. In this outlook, Breaking up with TINA (there is no alternative), we find ourselves on the other side of the market pendulum, seeing greater opportunity in 2023, albeit amidst a period of considerable uncertainty. Our outlook is tempered with humility and pragmatism, recognizing the future remains uncertain, as it always has. However, as the market dynamics have changed so have our opinions and we are excited to share our view for 2023 and beyond.
2023 Themes
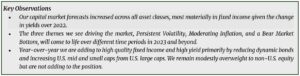
Rarely do market themes fit neatly into a calendar year and 2023 is no exception. However, there are three distinct themes in markets today which we believe are likely to unfold over varying time periods. Therefore, our views are presented as if they were three acts of a play. The first act is one in which changes are just beginning and will have long-term implications yet to be fully appreciated. The middle act is one in which change is obvious, but the resolution is not imminent. In the final act, we believe events are more likely to take place in the near term.
First Act: Persistent Volatility
In the first act of a play, facts and circumstances are often revealed about a character which in time will shape their path, but careful attention needs to be paid to see how these early clues may shift their trajectory. We view the reversal of zero-bound interest rates and the unraveling of globalization as those pivotal moments leading to higher long-term volatility for both stocks and bonds.
The last 10+ years in markets have been unique compared to long-term history. One could describe markets since the Global Financial Crisis as having low interest rates, low inflation and low growth coupled with maximum accommodation and maximum liquidity. These conditions have led to abnormally low volatility and have encouraged additional risk taking or TINA, the acronym for “there is no alternative” to owning more equity. We believe that reversing some, but not all, of these conditions may produce higher structural volatility across multiple asset classes. Additionally, these shifts may also mean that investors expecting the playbook of the last 10 years to be the same for the next 10 may be disappointed.
Middle Act: Moderating Inflation
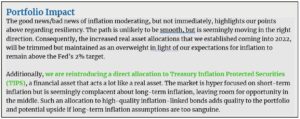
In the middle of the play, rising conflict is obvious, but the resolution has yet to take hold. These inflection points often leave the audience uneasy about the future. Inflation, and the Fed’s role in moderating it, is in its middle act. It is unlikely the curtain will drop on inflation in 2023 falling straight to the Fed’s long-term target of 2%. However, that is not what is required for a market bottom or for the Fed to pause. We simply need the path to resolution to be illuminated. So, while inflation may moderate over the years to come, its pivotal moment in market sentiment may be closer at hand given the recent slowing trend.
Final Act: Bear Market Bottom
In the final act, we fully grasp the conflict and perhaps even see what is necessary for resolution but are uncertain quite how it will play out. We believe we are in a similar place with markets bottoming. Let’s first build context around bear markets. Since 1950, the average pullback of 20% or more has lasted approximately 14 months; the longest of these was 31 months from March 2000 to October 2002. The shortest drawdown was less than two months in 2020. While there is no such thing as an average bear market, with history as a guide, our 11-month-old bear market is likely closer to its end than its beginning.
Now, how do bear markets typically unfold? The most common pattern is multiples contraction. This leads markets lower first, then the Fed ends a hiking cycle or begins an easing cycle and finally, earnings and expectations fall, creating a new base from which to build healthy forward expectations.
Index prices can be broken down into two primary components, earnings per share (EPS) and multiples. EPS is the economic value created by businesses and what investors are buying. Multiples are how much an investor is willing to pay for those earnings. Multiples are often driven by sentiment and are one of the first things reflected in prices. Corporate earnings, on the other hand, are backward-looking. Moreover, the impacts on businesses from higher interest rates and/or slowing demand takes time to appear in financial statements. Therefore, the typical pattern of bear markets is multiple contraction first, leading the market lower, followed by earnings.
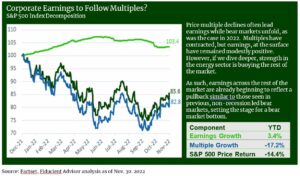
This was certainly the case in 2022 as illustrated in the chart above. Multiple contraction has accounted for more than 100% of the pullback as reported earnings remain modestly positive so far in 2022. The question remains, what role will earnings play in the market bottoming this time around?
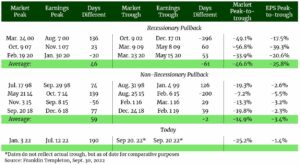
As shown in the table above, there is a meaningful difference in the earnings impact in recessionary versus non-recessionary environments. Our expectation remains that if a recession takes place, it will be a modest and a cyclically led recession rather than one driven by structural imbalances such as those that occurred during the Global Financial Crisis or an exogenous factor like COVID-19.
With that in mind, second and third quarter earnings began to reflect a potential modest economic contraction. In fact, second quarter earnings ex-energy were down 4.0% (up 6.2% with energy) and third quarter earnings with 99% of companies reported show earnings ex-energy down another 5.0% (up 2.5% with energy). Current estimates of fourth quarter earnings ex-energy anticipate an additional decline of 8.2%4. Why ex-energy? Russia’s invasion of Ukraine propelled commodity prices up, pushing earnings for the sector up 150.6% last year. This is unique to the energy sector and is not reflective of the rest of the market. All of this compares to earnings expectations (as late as June of this year) of 10.8% earnings growth for third quarter 20225. We wrote in our 2022 Outlook that these lofty expectations were a potential source of volatility as reality may not be as rosy and that has proven to be the case. All in, earnings are beginning to reflect the economic reality of a moderating economy, but likely have further to fall. This is a healthy step forward for a bear market bottom and again suggests we are nearer the end than the beginning.
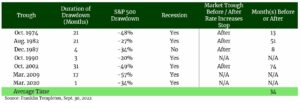
Finally, what role does the Fed play in all of this? To no surprise, given the Fed focus this year, an important one in our view. History has shown US markets tend to bottom after the Fed is done raising rates. Intuitively this makes sense. If the Fed is raising rates, they are proactively looking to cool economic activity by tightening financial conditions.
Yet given their dual mandates of price stability and full employment, the operative word is cool, not kill. When the Fed sees modest success in controlling inflation they should stop or pause. However, the full effect of higher rates takes some time to work through businesses and markets. It is a bit like turning the shower handle to change the temperature: you must wait a second to see if you got it right. Therefore, businesses are often amidst contraction when the Fed stops increasing rates. It is certainly conceivable that the market bottoms before the Fed officially stops as it tapers back from 0.75% moves to 0.50% to 0.25%. However, the market is less likely to bottom if the Fed is accelerating or maintaining its hawkish stance.
Final Thoughts
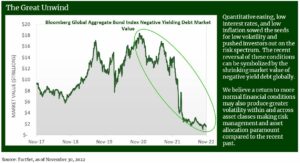
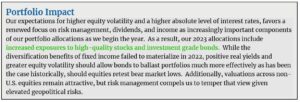
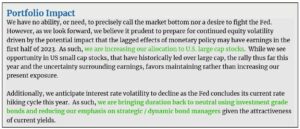
2022 was the reset button for many markets. Exiting zero-bound interest rate policies, moderating inflation and repricing global fixed income and equity have all helped sow the seeds for a brighter outlook in 2023 and beyond. While we anticipate volatile asset prices will persist in the year to come, leaning into newly created opportunities may prove to be the right decision over the long-term.
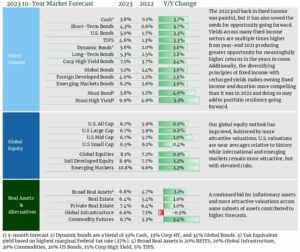
2023 10-Year Market Forecast Source: Cedar Cove Wealth Partners Capital Market Assumptions. Market and economic data including, but not limited to valuations, fixed income yields and inflation are used to derive forecasts. For further details, including index proxy information and methodologies, please reach out to your advisor. Outputs and opinions are as of the date referenced and are subject to change. Information is intended for general information purposes only and does not represent any specific investment recommendation. Please consult with your advisor, attorney, and accountant, as appropriate, regarding specific advice. There is no guarantee that any of these expectations will become actual results.
Footnotes:
- The Great Unwind; chart source: FactSet, as of November 30, 2022
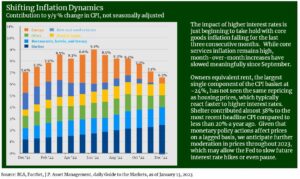
- Shifting Inflation Dynamics; Chart source BLS, FactSet, J.P. Asset Management, daily Guide to the Markets, as of January 13, 2023
- Corporate Earning to Follow Multiples?; chart source: Factset, Fiducient Advisor analysis as of Nov. 30. 2022
- FactSet Earnings Insight. As of January 13, 2023
- FactSet Earnings Insight. As of June 24, 2022
- Tables Source (earnings and peak-to-trough S&P 500 analysis): Franklin Templeton, Sept. 30, 2022
Disclosures and Definitions
Comparisons to any indices referenced herein are for illustrative purposes only and are not meant to imply that actual returns or volatility will be similar to the indices. Indices cannot be invested in directly. Unmanaged index returns assume reinvestment of any and all distributions and do not reflect our fees or expenses.
- Bloomberg Commodity Index is calculated on an excess return basis and reflects commodity futures price movements. The index rebalances annually weighted 2/3 by trading volume and 1/3 by world production and weight-caps are applied at the commodity, sector and group level for diversification.
- Bloomberg U.S. Aggregate Index covers the U.S. investment grade fixed rate bond market, with index components for government and corporate securities, mortgage pass-through securities, and asset-backed securities.
- Bloomberg U.S. Corporate High Yield Index covers the universe of fixed rate, non-investment grade debt. Eurobonds and debt issues from countries designated as emerging markets (sovereign rating of Baa1/BBB+/BBB+ and below using the middle of Moody’s, S&P, and Fitch) are excluded, but Canadian and global bonds (SEC registered) of issuers in non-EMG countries are included.
- Consumer Price Index (CPI) is a measure of the average change over time in the prices paid by urban consumers for a market basket of consumer goods and services.
- FTSE (Financial Times Stock Exchange) NAREIT Equity REITs Index contains all Equity REITs not designed as Timber REITs or Infrastructure REITs.
- MSCI EAFE (Morgan Stanley Capital International Europe, Australasia, and the Far East) is an equity index which captures large and mid-cap representation across Developed Markets countries around the world, excluding the U.S. and Canada. The index covers approximately 85% of the free float-adjusted market capitalization in each country.
- MSCI (Morgan Stanley Capital International) Emerging Markets captures large and mid-cap representation across Emerging Markets countries. The index covers approximately 85% of the free-float adjusted market capitalization in each country.
- MSCI (Morgan Stanley Capital International) China® Index captures large and mid-cap representation across China A shares, H shares, B shares, Red chips, P chips and foreign listings (e.g. ADRs). With 717 constituents, the index covers about 85% of this China equity universe.
- Russell 2000 consists of the 2,000 smallest U.S. companies in the Russell 3000 index.
- S&P 500 is a capitalization-weighted index designed to measure performance of the broad domestic economy through changes in the aggregate market value of 500 stocks representing all major industries.
- S. Dollar Index – known as USDX, DXY, DX and USD Index – is a measure of the value of the United States Dollar (USD) against a weighted basket of currencies used by U.S. trade partners. The index will rise if the Dollar strengthens against these currencies and fall if it weakens.
- The Bureau of Economic Analysis (BEA) is an agency of the Department of Commerce that produces economic accounts statistics that enable government and business decision-makers, researchers, and the American public to follow and understand the performance of the nation’s economy. To do this, BEA collects source data, conducts research and analysis, develops and implements estimation methodologies, and disseminates statistics to the public.
- The Federal Open Market Committee (FOMC) is the branch of the Federal Reserve System that determines the direction of monetary policy.
- FRED (Federal Reserve Economic Data) is an online database consisting of hundreds of thousands of economic data time series from scores of national, international, public, and private sources.
- CME FedWatch Tool, is a tool created by the CME Group (Chicago Mercantile Exchange Group) to act as a barometer for the market’s expectation of potential changes to the fed funds target rate while assessing potential Fed movements around Federal Open Market Committee (FOMC) meetings.
The material presented includes information and opinions provided by a party not related to Thrivent Advisor Network. It has been obtained from sources deemed reliable; but no independent verification has been made, nor is its accuracy or completeness guaranteed. The opinions expressed may not necessarily represent those of Thrivent Advisor Network or its affiliates. They are provided solely for information purposes and are not to be construed as solicitations or offers to buy or sell any products, securities, or services. They also do not include all fees or expenses that may be incurred by investing in specific products. Past performance is no guarantee of future results. Investments will fluctuate and when redeemed may be worth more or less than when originally invested. You cannot invest directly in an index. The opinions expressed are subject to change as subsequent conditions vary. Thrivent Advisor Network and its affiliates accept no liability for loss or damage of any kind arising from the use of this information.
This communication may include forward looking statements. Specific forward-looking statements can be identified by the fact that they do not relate strictly to historical or current facts and include, without limitation, words such as “may,” “will,” “expects,” “believes,” “anticipates,” “plans,” “estimates,” “projects,” “targets,” “forecasts,” “seeks,” “could’” or the negative of such terms or other variations on such terms or comparable terminology. These statements are not guarantees of future performance and involve risks, uncertainties, assumptions and other factors that are difficult to predict and that could cause actual results to differ materially.
Investment advisory services offered through Thrivent Advisor Network, LLC., (herein referred to as “Thrivent”), a registered investment adviser. Clients will separately engage an unaffiliated broker-dealer or custodian to safeguard their investment advisory assets. Review the Thrivent Advisor Network Financial Planning and Consulting Services, Investment Management Services (Non-Wrap) and Wrap-Fee Program brochures (Form ADV Part 2A and 2A Appendix 1 brochures) for a full description of services, fees and expenses, available at Thriventadvisornetwork.com. Thrivent Advisor Network, LLC financial advisors may also be registered representatives of a broker-dealer to offer securities products.
Certain Thrivent Advisor Network LLC advisors may also be registered representatives of a broker-dealer to offer securities products. Advisory Persons of Thrivent provide advisory services under a “doing business as” name or may have their own legal business entities. However, advisory services are engaged exclusively through Thrivent Advisor Network, LLC, a registered investment adviser. Please visit our website www.thriventadvisornetwork.com for important disclosures.
Advisory Persons of Thrivent provide advisory services under a “doing business as” name or may have their own legal business entities. However, advisory services are engaged exclusively through Thrivent Advisor Network, LLC, a registered investment adviser. Cedar Cove Wealth Partners and Thrivent Advisor Network, LLC are not affiliated companies. Information in this message is for the intended recipient[s] only. Please visit our website www.cedarcovewealth.com for important disclosures.
Securities offered through Purshe Kaplan Sterling Investments (“PKS”), Member FINRA/SIPC. PKS is headquartered at 80 State Street, Albany, NY 12207. PKS and Cedar Cove Wealth Partners are not affiliated companies.
