
Market Recap
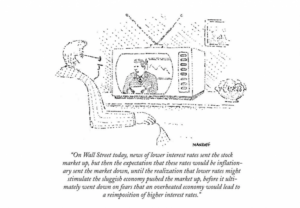
A broad risk rally in Q4 2023 benefitted owners of risk-assets such as stocks and bonds relative to cash. The drivers of this rally were primarily centered on a positive shift in sentiment and the expectation that monetary policy would shift its posture to an accommodative stance on good news of an immaculate dis-inflation. That means the market is currently pricing in an unlikely scenario where inflation comes down to the 2% target sustainably so the Fed can decrease rates without a recession. However, as noted in previous commentaries, this market narrative stands in contrast to the previous quarter where expectations of ‘higher for longer’ interest rates were dominant. The uncertainty surrounding the path of inflation and interest rates are highlighted in the satirical cartoon below that was originally published in 1981 by the New Yorker. (1)
The fourth quarter opened with a new war in the middle east in October. Following Hamas’ October 7 attack on Israel, crude, gold, and shares of defense companies all initially rallied. Crude retraced its gains, while gold and defense stocks remained strong. Despite the tremendous and tragic loss of human life, the conflict was not the primary driver of global financial markets over the quarter.
- Commodity prices tend to have an inverse relationship with the U.S. dollar, however a -4.6% decline in the U.S. dollar did little to support commodities that declined by -4.6%. Non-OPEC+ supply strength coincided with expectations of slowing global oil demand for WTI, which declined by -20.8%. Energy was also the only S&P 500 sector to finish the quarter down. (3)
- US Stocks and bonds both traded higher for the quarter with duration proving to be a common tailwind. Bonds rallied in alignment with their duration as the yield on the 10-year Treasury note ended the year roughly where it began near 3.9%, down from its October peak of 5%. The roundtrip journey for the 10-year yield reflected the shifting winds of market sentiment regarding the uncertain path of monetary policy.
- US stocks rallied on expectations that the Fed has not just stopped hiking rates, but that it will begin cutting rates in Q1 2024. Top performing sectors were those most sensitive to interest rates, including tech, real estate and financials.
- International equities underperformed domestic markets with developed markets outperforming emerging by about 3%. Emerging markets continued to be pulled lower by China exposure, which ended the quarter down 4.4%. (5)
- Real assets rallied on the quarter as real estate outperformed and listed infrastructure matched returns of the broader S&P 500. These bond proxies and inflation hedges rallied in alignment with higher duration bonds as expectations for lower rates boosted valuations, making their yields relatively more attractive compared to bonds.
Concluding Thoughts
The broad stock and bond rally in the fourth quarter is largely based on a Goldilocks scenario playing out where inflation sustainably falls to the Fed’s 2% target rate without a recession occurring. Both investment grade and high yield bonds rallied along with stocks on the expectation that the Fed would begin to ease rates in Q1 2024, while economic growth remains strong. This ‘soft landing’ scenario has placed financial markets in a position that is vulnerable to downside surprises, however strong investor sentiment carried many markets to a positive conclusion in 2023.
Footnotes
(1) Cartoon. On Wall Street Today. New Yorker. Pixels.com.October, 12, 1981
(3) Morningstar Direct as of December 31, 2023. US Dollar shown on a price return basis, Bloomberg Commodity TR USD, West Texas Crude Intermediate Oil Barrell, and S&P 500 Energy Sector TR USD .
(4) The indexes referenced are the Bloomberg US Aggregate Total Return, Bloomberg US Municipal Total Return, Bloomberg US Corporate High Yield TR USD, Bloomberg Global Aggregate TR USD indexes, Bloomberg Commodity TR USD, and the US dollar measure relative to a basket of foreign currencies using its weighted geometric mean of EUR (57.6%), JPY (13.6%), GBP (11.9%), CAD (9.1%), SEK (4.2%), CHF (3.6%). Q4 returns are for the period from 10/1/2023-12/31/2023; year-to-date (YTD) returns are from 1/1/2023 – 12/31/2023.
(5) Morningstar Direct as of December 31, 2023. MSCI China price return USD.
Disclosures and Definitions
Comparisons to any indices referenced herein are for illustrative purposes only and are not meant to imply that actual returns or volatility will be similar to the indices. Indices cannot be invested in directly. Unmanaged index returns assume reinvestment of any and all distributions and do not reflect our fees or expenses.
- The Bloomberg Global Aggregate® Index is a flagship measure of global investment grade debt from twenty-four local currency markets. This multi-currency benchmark includes treasury, government-related, corporate and securitized fixed-rate bonds from both developed and emerging markets issuers.
- The Bloomberg U.S. Aggregate® Index covers the U.S. investment grade fixed rate bond market, with index components for government and corporate securities, mortgage pass-through securities, and asset-backed securities.
- The Bloomberg U.S. Corporate High Yield® Index covers the universe of fixed rate, non-investment grade debt. Eurobonds and debt issues from countries designated as emerging markets (sovereign rating of Baa1/BBB+/BBB+ and below using the middle of Moody’s, S&P, and Fitch) are excluded, but Canadian and global bonds (SEC registered) of issuers in non-EMG countries are included.
- The Bloomberg U.S. Municipal® Index covers the USD-denominated long-term tax-exempt bond market. The index has four main sectors: state and local general obligation bonds, revenue bonds, insured bonds and pre-refunded bonds.
- The Bloomberg Commodity® Index is calculated on an excess return basis and reflects commodity futures price movements. The index rebalances annually weighted 2/3 by trading volume and 1/3 by world production and weight-caps are applied at the commodity, sector and group level for diversification.
- The Dow Jones Industrial Average (DJIA), also known as the Dow 30, is a stock market index that tracks 30 large, publicly owned blue-chip companies trading on the New York Stock Exchange (NYSE) and the NASDAQ.
- The Federal Funds Rate is the target interest rate range set by the FOMC. This is the rate at which commercial banks borrow and lend their excess reserves to each other overnight. The FOMC sets a target federal funds rate eight times a year, based on prevailing economic conditions.
- The Federal Open Market Committee (FOMC) is the branch of the Federal Reserve System that determines the direction of monetary policy.
- The MSCI (Morgan Stanley Capital International) China® Index captures large and mid-cap representation across China A shares, H shares, B shares, Red chips, P chips and foreign listings (e.g. ADRs). With 717 constituents, the index covers about 85% of this China equity universe.
- The MSCI EAFE (Morgan Stanley Capital International Europe, Australasia, and the Far East) ® Index is an equity index which captures large and mid-cap representation across Developed Markets countries around the world, excluding the U.S. and Canada. The index covers approximately 85% of the free float-adjusted market capitalization in each country.
- The MSCI (Morgan Stanley Capital International) Emerging Markets® Index captures large and mid-cap representation across Emerging Markets countries. The index covers approximately 85% of the free-float adjusted market capitalization in each country.
- The NASDAQ (National Association of Securities Dealers Automated Quotations) Composite Index is the market capitalization-weighted index of over 2,500 common equities listed on the NASDAQ stock exchange.
- The Organization of the Petroleum Exporting Countries (OPEC) is a permanent, intergovernmental Organization, created at the Baghdad Conference on September 10–14, 1960, by Iran, Iraq, Kuwait, Saudi Arabia and Venezuela. OPEC’s objective is to co-ordinate and unify petroleum policies among Member Countries, in order to secure fair and stable prices for petroleum producers; an efficient, economic and regular supply of petroleum to consuming nations; and a fair return on capital to those investing in the industry.
- The Russell 1000 Growth® Index measures the performance of the Russell 1000® ‘s growth segment, which is defined to include firms whose share prices have higher price-to-book ratios and higher expected earnings growth rates.
- The Russell 1000 Value® Index measures the performance of the large-cap value segment of the U.S. equity universe. It includes those Russell 1000® companies with lower price-to-book ratios and lower expected and historical growth rates.
- The Russell 2000® Index measures the performance of the 2,000 smaller companies that are included in the Russell 3000® Index, which itself is made up of nearly all U.S. stocks. The Russell 2000® is widely regarded as a bellwether of the U.S. economy because of its focus on smaller companies that focus on the U.S. market.
- The Russell Midcap® Index is a market capitalization-weighted index comprised of 800 publicly traded U.S. companies with market caps of between $2 and $10 billion. The 800 companies in the Russell Midcap® Index are the 800 smallest of the 1,000 companies that comprise Russell 1000® Index.
- The S&P 500 ® Index is a capitalization-weighted index designed to measure performance of the broad domestic economy through changes in the aggregate market value of 500 stocks representing all major industries.
- The S. Dollar Index – known as USDX, DXY, DX and USD Index – is a measure of the value of the United States Dollar (USD) against a weighted basket of currencies used by U.S. trade partners. The index will rise if the Dollar strengthens against these currencies and fall if it weakens.
- The West Texas Intermediate ®Index (WTI), is the main oil benchmark for North America as it is sourced from the United States, primarily from the Permian Basin. The oil comes mainly from Texas.
Material Risks
- Fixed Income securities are subject to interest rate risks, the risk of default and liquidity risk. U.S. investors exposed to non-U.S. fixed income may also be subject to currency risk and fluctuations.
- Cash may be subject to the loss of principal and over longer periods of time may lose purchasing power due to inflation.
- Domestic Equity can be volatile. The rise or fall in prices take place for a number of reasons including, but not limited to changes to underlying company conditions, sector or industry factors, or other macro events. These may happen quickly and unpredictably.
- International Equity can be volatile. The rise or fall in prices take place for a number of reasons including, but not limited to changes to underlying company conditions, sector or industry impacts, or other macro events. These may happen quickly and unpredictably. International equity allocations may also be impacted by currency and/or country specific risks which may result in lower liquidity in some markets.
This material is provided for informational purposes only and is not solely intended to be relied upon as a forecast, research or investment advice, and is not a recommendation, offer or solicitation to buy or sell any securities or to adopt any investment strategy. The views and strategies described may not be suitable for all investors. They also do not include all fees or expenses that may be incurred by investing in specific products. Past performance is no guarantee of future results. Investments will fluctuate and when redeemed may be worth more or less than when originally invested. You cannot invest directly in an index. The opinions expressed are subject to change as subsequent conditions vary. Advisory services offered through Thrivent Advisor Network, LLC.
This communication may include forward looking statements. Specific forward-looking statements can be identified by the fact that they do not relate strictly to historical or current facts and include, without limitation, words such as “may,” “will,” “expects,” “believes,” “anticipates,” “plans,” “estimates,” “projects,” “targets,” “forecasts,” “seeks,” “could’” or the negative of such terms or other variations on such terms or comparable terminology. These statements are not guarantees of future performance and involve risks, uncertainties, assumptions and other factors that are difficult to predict and that could cause actual results to differ materially.
The material presented includes information and opinions provided by a party not related to Thrivent Advisor Network. It has been obtained from sources deemed reliable; but no independent verification has been made, nor is its accuracy or completeness guaranteed. The opinions expressed may not necessarily represent those of Thrivent Advisor Network or its affiliates. They are provided solely for information purposes and are not to be construed as solicitations or offers to buy or sell any products, securities, or services. They also do not include all fees or expenses that may be incurred by investing in specific products. Past performance is no guarantee of future results. Investments will fluctuate and when redeemed may be worth more or less than when originally invested. You cannot invest directly in an index. The opinions expressed are subject to change as subsequent conditions vary. Thrivent Advisor Network and its affiliates accept no liability for loss or damage of any kind arising from the use of this information.
Investment advisory services offered through Thrivent Advisor Network, LLC., (herein referred to as “Thrivent”), a registered investment adviser. Clients will separately engage an unaffiliated broker-dealer or custodian to safeguard their investment advisory assets. Review the Thrivent Advisor Network Financial Planning and Consulting Services, Investment Management Services (Non-Wrap) and Wrap-Fee Program brochures (Form ADV Part 2A and 2A Appendix 1 brochures) for a full description of services, fees and expenses, available at Thriventadvisornetwork.com. Thrivent Advisor Network, LLC financial advisors may also be registered representatives of a broker-dealer to offer securities products.
Certain Thrivent Advisor Network LLC advisors may also be registered representatives of a broker-dealer to offer securities products. Advisory Persons of Thrivent provide advisory services under a “doing business as” name or may have their own legal business entities. However, advisory services are engaged exclusively through Thrivent Advisor Network, LLC, a registered investment adviser. Please visit our website www.thriventadvisornetwork.com for important disclosures.
The opinions expressed are subject to change as subsequent conditions vary. Reliance upon information in this material is at the sole discretion of the reader. International investing involves additional risks, including risks related to foreign currency, limited liquidity, government regulation and the possibility of substantial volatility due to adverse political, economic or other developments. The two main risks related to fixed income investing are interest rate risk and credit risk. Typically, when interest rates rise, there is a corresponding decline in the market value of bonds. Credit risk refers to the possibility that the issuer of the bond will not be able to make principal and interest payments. Index performance is shown for illustrative purposes only.
Advisory Persons of Thrivent provide advisory services under a “doing business as” name or may have their own legal business entities. However, advisory services are engaged exclusively through Thrivent Advisor Network, LLC, a registered investment adviser. Cedar Cove Wealth Partners and Thrivent Advisor Network, LLC are not affiliated companies. Information in this message is for the intended recipient[s] only. Please visit our website www.cedarcovewealth.com for important disclosures.
Securities offered through Purshe Kaplan Sterling Investments (“PKS”), Member FINRA/SIPC. PKS is headquartered at 80 State Street, Albany, NY 12207. PKS and Cedar Cove Wealth Partners are not affiliated companies.
