
Key Observations
- The S&P 500 entered a “correction”, defined as a pullback of 10% or more; intra-year corrections are not uncommon for equity markets.
- Fixed income continues to struggle based on a myriad of factors including Fed narrative, an elusive recession and higher issuance by the US Treasury.
- Small caps have struggled this year on a few simple narratives but may offer unique opportunity relative to their large cap peers.
Market Recap
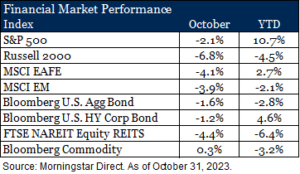
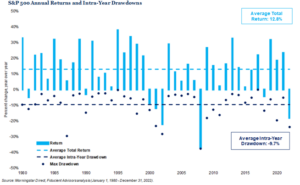
Markets across global equity and fixed income added a third month of decline in October. Technically, the S&P 500 entered a “correction”, defined as a pullback of 10% or more, since recent highs achieved in July. Intra-year declines of this magnitude are not uncommon and as demonstrated in the chart below, coincidentally align with the average intra-year decline on the S&P 500 since 1980. The recent struggles for fixed income are however, less common. Should the Bloomberg U.S. Aggregate Bond Index close the year in negative territory it will be the first consecutive three-year decline since the creation of the aggregate index in the 1970s (1). In particular, long duration bonds, as measured by the Bloomberg U.S. Long Gov/Credit, fell -4.5% over the month pushing its total return to -9.7% for the calendar year (1). We believe several factors participated in driving bond prices lower. The Fed’s continued narrative of “higher for longer (interest rates)”, a rolling view of a coming recession that has yet to arrive, and several technical factors with the Fed engaged in quantitative tightening and increasing Treasury supply following months of inability to do so based on debt ceiling restrictions. The resulting higher yields will be a key point of discussion in our forthcoming 2024 outlook as we review the forward-looking opportunity fixed income may offer long-term investors.
The S&P Sneezes & Small Caps Catch a Cold
Small cap U.S. stocks have struggled to find their footing this year. After a strong first quarter start, they were quickly overtaken by the buzz of Artificial Intelligence (AI) and the moniker of “the Magnificent Seven” was born. As markets and temperatures in the northern hemisphere have cooled it looks like the S&P may have sneezed, but it is small caps that caught a cold. What gives?
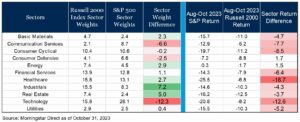
First, it is instructive to note that the small cap index, defined as the Russell 2000, is not just a smaller clone of its larger sibling index. As a residual of the securities in each index, the sector weightings and complexion can differ materially from large and small cap indexes. As demonstrated below, the variance in sector weights have been up to 12% over the last three months. Moreover, the returns within a sector from large to small cap can vary considerably. By way of example, large cap healthcare outperformed small cap healthcare over the last three-months by 18.7%. Moreover, only two small cap sectors modestly outperformed their large cap peers over the same period. Closer examination of the recent period shows small caps have been plagued by both a higher exposure to poor performing sectors and materially worse sector returns. Small cap healthcare in particular has been hit by a combination of higher interest rates calling into question the viability of some businesses and weight loss drugs potentially leading to lower demand.
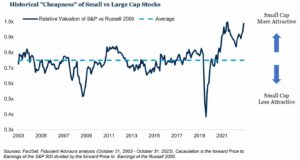
However, as we zoom out from recent performance the relationship between small and large cap stocks is in an interesting place. Since 2003, small cap companies on average have traded at a 35% valuation premium relative to large cap indexes. This is on the premise of higher growth and therefore higher return potential. In fact, over the last 20 years the Russell 2000 index has grown its earnings per share (EPS) more than 2x that of the S&P 500. Yet, at present, large cap and small cap indexes are at near equal valuations. On a relative basis this makes small caps appear attractive to larger peers.
This narrative alone for small vs large caps is far too simple to be an investment thesis. For example, earnings per share (EPS) growth for the Russell 2000 over the last year was -24% whereas the S&P 500 was down -4% by comparison (2). However, it does highlight an anomaly occurring with both the relative valuation and the concentration in the S&P 500 driven by the Magnificent Seven.
Outlook
We will be releasing our 2024 Outlook in the coming months in which we’ll delve into these topics and more. Check back in to hear our most pertinent themes driving markets in 2024 and how to position portfolios accordingly.
Endnotes
- Source: FactSet as of October 31, 2023
- Source: FactSet as of October 31, 2023
Disclosures & Definitions
Comparisons to any indices referenced herein are for illustrative purposes only and are not meant to imply that actual returns or volatility will be similar to the indices. Indices cannot be invested in directly. Unmanaged index returns assume reinvestment of any and all distributions and do not reflect our fees or expenses.
- The S&P 500 is a capitalization-weighted index designed to measure performance of the broad domestic economy through changes in the aggregate market value of 500 stocks representing all major industries.
- Russell 2000 consists of the 2,000 smallest U.S. companies in the Russell 3000 index.
- MSCI EAFE is an equity index which captures large and mid-cap representation across Developed Markets countries around the world, excluding the U.S. and Canada. The index covers approximately 85% of the free float-adjusted market capitalization in each country.
- MSCI Emerging Markets captures large and mid-cap representation across Emerging Markets countries. The index covers approximately 85% of the free-float adjusted market capitalization in each country.
- Bloomberg U.S. Aggregate Index covers the U.S. investment grade fixed rate bond market, with index components for government and corporate securities, mortgage pass-through securities, and asset-backed securities.
- Bloomberg U.S. Corporate High Yield Index covers the universe of fixed rate, non-investment grade debt. Eurobonds and debt issues from countries designated as emerging markets (sovereign rating of Baa1/BBB+/BBB+ and below using the middle of Moody’s, S&P, and Fitch) are excluded, but Canadian and global bonds (SEC registered) of issuers in non-EMG countries are included.
- FTSE NAREIT Equity REITs Index contains all Equity REITs not designed as Timber REITs or Infrastructure REITs.
- Bloomberg Commodity Index is calculated on an excess return basis and reflects commodity futures price movements. The index rebalances annually weighted 2/3 by trading volume and 1/3 by world production and weight-caps are applied at the commodity, sector and group level for diversification.
- Bloomberg US Government/Credit Long Index is the Long component of the U.S. Government/Credit Index, which includes securities in the Government and Credit Indices. The Government Index includes treasuries and agencies, while the credit index includes publicly issued U.S. corporate and foreign debentures and secured notes that meet specified maturity, liquidity and quality requirements.
Material Risks
- Fixed Income securities are subject to interest rate risks, the risk of default and liquidity risk. U.S. investors exposed to non-U.S. fixed income may also be subject to currency risk and fluctuations.
- Cash may be subject to the loss of principal and over longer periods of time may lose purchasing power due to inflation.
- Domestic Equity can be volatile. The rise or fall in prices take place for a number of reasons including, but not limited to changes to underlying company conditions, sector or industry factors, or other macro events. These may happen quickly and unpredictably.
- International Equity can be volatile. The rise or fall in prices take place for a number of reasons including, but not limited to changes to underlying company conditions, sector or industry impacts, or other macro events. These may happen quickly and unpredictably. International equity allocations may also be impact by currency and/or country specific risks which may result in lower liquidity in some markets.
- Real Assets can be volatile and may include asset segments that may have greater volatility than investment in traditional equity securities. Such volatility could be influenced by a myriad of factors including, but not limited to overall market volatility, changes in interest rates, political and regulatory developments, or other exogenous events like weather or natural disaster.
- Private Real Estate involves higher risk and is suitable only for sophisticated investors. Real estate assets can be volatile and may include unique risks to the asset class like leverage and/or industry, sector or geographical concentration. Declines in real estate value may take place for a number of reasons including, but are not limited to economic conditions, change in condition of the underlying property or defaults by the borrow.
This material is provided for informational purposes only and is not solely intended to be relied upon as a forecast, research or investment advice, and is not a recommendation, offer or solicitation to buy or sell any securities or to adopt any investment strategy. The views and strategies described may not be suitable for all investors. They also do not include all fees or expenses that may be incurred by investing in specific products. Past performance is no guarantee of future results. Investments will fluctuate and when redeemed may be worth more or less than when originally invested. You cannot invest directly in an index. The opinions expressed are subject to change as subsequent conditions vary. Advisory services offered through Thrivent Advisor Network, LLC.
This communication may include forward looking statements. Specific forward-looking statements can be identified by the fact that they do not relate strictly to historical or current facts and include, without limitation, words such as “may,” “will,” “expects,” “believes,” “anticipates,” “plans,” “estimates,” “projects,” “targets,” “forecasts,” “seeks,” “could’” or the negative of such terms or other variations on such terms or comparable terminology. These statements are not guarantees of future performance and involve risks, uncertainties, assumptions and other factors that are difficult to predict and that could cause actual results to differ materially.
The material presented includes information and opinions provided by a party not related to Thrivent Advisor Network. It has been obtained from sources deemed reliable; but no independent verification has been made, nor is its accuracy or completeness guaranteed. The opinions expressed may not necessarily represent those of Thrivent Advisor Network or its affiliates. They are provided solely for information purposes and are not to be construed as solicitations or offers to buy or sell any products, securities, or services. They also do not include all fees or expenses that may be incurred by investing in specific products. Past performance is no guarantee of future results. Investments will fluctuate and when redeemed may be worth more or less than when originally invested. You cannot invest directly in an index. The opinions expressed are subject to change as subsequent conditions vary. Thrivent Advisor Network and its affiliates accept no liability for loss or damage of any kind arising from the use of this information.
Investment advisory services offered through Thrivent Advisor Network, LLC., (herein referred to as “Thrivent”), a registered investment adviser. Clients will separately engage an unaffiliated broker-dealer or custodian to safeguard their investment advisory assets. Review the Thrivent Advisor Network Financial Planning and Consulting Services, Investment Management Services (Non-Wrap) and Wrap-Fee Program brochures (Form ADV Part 2A and 2A Appendix 1 brochures) for a full description of services, fees and expenses, available at Thriventadvisornetwork.com. Thrivent Advisor Network, LLC financial advisors may also be registered representatives of a broker-dealer to offer securities products.
Certain Thrivent Advisor Network LLC advisors may also be registered representatives of a broker-dealer to offer securities products. Advisory Persons of Thrivent provide advisory services under a “doing business as” name or may have their own legal business entities. However, advisory services are engaged exclusively through Thrivent Advisor Network, LLC, a registered investment adviser. Please visit our website www.thriventadvisornetwork.com for important disclosures.
The opinions expressed are subject to change as subsequent conditions vary. Reliance upon information in this material is at the sole discretion of the reader. International investing involves additional risks, including risks related to foreign currency, limited liquidity, government regulation and the possibility of substantial volatility due to adverse political, economic or other developments. The two main risks related to fixed income investing are interest rate risk and credit risk. Typically, when interest rates rise, there is a corresponding decline in the market value of bonds. Credit risk refers to the possibility that the issuer of the bond will not be able to make principal and interest payments. Index performance is shown for illustrative purposes only.
Advisory Persons of Thrivent provide advisory services under a “doing business as” name or may have their own legal business entities. However, advisory services are engaged exclusively through Thrivent Advisor Network, LLC, a registered investment adviser. Cedar Cove Wealth Partners and Thrivent Advisor Network, LLC are not affiliated companies. Information in this message is for the intended recipient[s] only. Please visit our website www.cedarcovewealth.com for important disclosures.
Securities offered through Purshe Kaplan Sterling Investments (“PKS”), Member FINRA/SIPC. PKS is headquartered at 80 State Street, Albany, NY 12207. PKS and Cedar Cove Wealth Partners are not affiliated companies.
