
Market Recap
- 2023 is shaping up to be a tale of two halves; a historically strong recovery off a recent bottom described the first half of the year as expectations for a recession proved too early and U.S. economic resilience offered surprising earnings support from better-than-expected margins that offset stagnating top-line revenues. One quarter into the second half of the year, investors’ expectations pivoted, abandoning economic caution in anticipation of a recession that, by some measures, appears to have been avoided, while repricing interest rate expectations to remain “higher for longer”, taking cues from the latest Summary of Economic Projections (SEPs) published by the FOMC in September. (1) The results have been night and day, turning tailwinds into headwinds that offered few hiding places during the quarter.
- Commodities, cash, and the U.S. dollar stood out among broad asset classes, generating gains in an otherwise down quarter. The boost to commodities was primarily driven by crude oil pumping up almost 30%, helping lift the production weighted S&P GSCI index nearly 16%. Cash, as measured by the yield on one month Treasury bills banked 1.3%, reflecting hikes in the Fed fund rates that have raised the current target rate to 5.25% – 5.50%. While yields rose across much of the globe, economic uncertainty in the Eurozone, UK, and China, as well as continued monetary accommodations in Japan, helped boost the U.S. dollar 3.2% for the quarter. (2)
- US Stock and bonds both traded lower for the quarter with duration proving to be a common headwind. Within credit markets, long-term Treasury bonds fell 13% as the 10-year yield rose 78 bps but was eclipsed by gains in both the 20- and 30-year yields that rose 86 and 88 bps and the former closing at 4.92%. Higher yields compressed valuations across stocks with the technology heavy NASDAQ giving back 3.9%, while large cap growth and value fell in tandem about 3.1%. (3)
- In local currency terms global equities outperformed for the quarter with emerging markets besting developed by a narrow margin. However, after adjusting returns to reflect dollar gains the MSCI EM and MSCI EAFE indices straddled domestic losses, dropping 2.9% and 4.1%, respectively.
- Real assets fell for the quarter as real estate, utilities, and infrastructure dividends were discounted by higher bond yields pushing equity prices lower, though rising real rates limited losses in TIPS, and commodities rose.
Equity
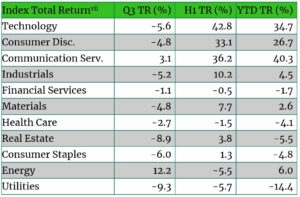
- U.S. equities, as measured by the S&P 500, delivered quarterly losses for the first time since Q3 2022, with nine out of eleven sectors finishing lower. Energy and communication services were the two sectors that finished positive, gaining 12.2% and 3.1%, respectively. Energy and the broader commodity complex were supported by better-than-expected U.S. economic data suggesting late-cycle strength, as well as global constraints that impacted the supply of crude oil.
- U.S. large cap declines were also impacted by the divergence of returns among the “magnificent 7” with the world’s two largest companies, Apple and Microsoft, dropping 11.6% and 7.1%, contributing 26% of the index’s total losses for the quarter. Conversely, Alphabet (Google), Meta Platforms (Facebook), and Nvidia continued to generate strong returns rising 9.3%, 4.6%, and 2.8%, respectively. Negative returns and the drop in correlations among these companies contributed to the NASDAQ’s -3.9% loss for the quarter. (4)
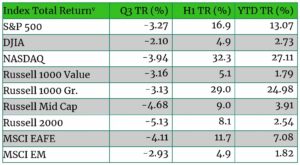
- Small and mid-cap stocks continued to underperform large caps with the Russell 2000 dropping 5.1% and the Russell Mid Cap falling 4.7%. While all three measurers of capitalization are positive for the year, small caps are off to their fourth worst start relative to large caps since 1979. (6) Additionally, though returns across capitalizations were more almost 2% wide for the quarter, returns across growth and value styles were nearly identical amongst large caps, though year-to-date growth remains a clear leader up more than 23%.
- Regionally, equity returns were more similar than dissimilar, though India stood out at the county level rising 2.7% on the back of strong fiscal spending supporting infrastructure development. Positive India returns and China equities losing only 1.9% as economic weakness appeared to bottom based on recent PMI data, helped Emerging Markets outperform developed markets, though remained negative on an absolute basis. Europe’s largest economy continued to exhibit slowing, with German manufacturing particularly weak, which weighed on the MSCI Germany NR Index, down 7.7% for the quarter. (8)
Fixed Income
- US. credit markets generally delivered poor results and the worst quarter of performance for the year as the relentless rise in yields accelerated in September. The inversion between the two and ten-year Treasury yields improved by almost 50 bps during the quarter, ending at -0.96%. (9) Steepening at the long end of the yield curve likely reflected better than expected economic data in the US, as well as political dysfunction in Washington that resulted in Republicans abdicating leadership of the House after now former Speaker McCarthy crossed party lines to avoid a government shutdown. Elevated levels of Treasury issuance in the second half of the year and anticipated Federal deficits were additional factors investors had to weigh when purchasing Treasuries.
- The Bloomberg U.S. Aggregate fell 3.2% for the quarter, pulling total returns for the year negative. S. Municipal Bonds faced technical headwinds including a year-over-year increase in supply and continued redemptions that now total $12.0B, as well as early indications of weakening fundamentals at the state and local level that are beginning to produce budget deficits. (10)
- Despite positive but generally slowing U.S. economic data, favorable term structures established prior to the Fed’s latest tightening cycle, as well as better than expected earnings results supported stable credit spreads and helped high yield bonds and floating rate loans finish positive for the quarter, gaining 0.5% and 3.4%. (12)
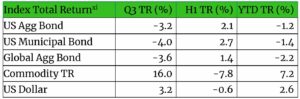
- The strengthening dollar and tighter monetary policy conditions across the majority of developed central banks weighed on global bond returns with the Bloomberg Global Aggregate index finishing down 3.6% for the quarter and now negative 1.4% on the year.
Real Assets
- REITs continued to decline as higher interest rates reduce the value of future cash flows and property valuations. All sectors finished negative for the quarter with infrastructure and diversified sub-sectors among the worst performing while office REITs declined the least, which likely reflects prior price adjustments earlier in the year that anticipated rising commercial real estate defaults given sustained vacancy rates. (13)
- Commodities were a standout in the third quarter delivering strong results on the back of higher energy prices led by Brent and West Texas Intermediate Crude futures thrust higher by supply constraints as the result of better-than-expected OPEC+ member compliance and the ongoing administration of Russian sanctions that limit exports of natural gas and oil. West Texas Intermediate Crude (WTI) gained 28.5% during the quarter. (14)
Concluding Thoughts
Equities have rallied significantly off lows established last October as recession expectations failed to materialize. While monetary policy has yet to work its way through the economy, its “long and variable lags,” as described by Milton Friedman, have not vanished but merely been delayed by the impacts of fiscal stimulus and near zero interest rate policies enacted to counteract act a global pandemic. While it remains possible and preferable for the U.S. to achieve a soft landing and cushion slowing global growth, it remains improbable. When coupled with the geopolitical risks in the Middle East and Ukraine, Washington’s political dysfunction and increasing comfort with sovereign deficits, a cautious stance remains warranted.
Footnotes
- The central tendency of FOMC participants’ projections at the end 2024 were revised higher in the September SEPs, rising to 4.6%-5.4%, with 10 members seeing rates remaining at 5.125% or higher.
- All performance returns are shown as total return. The S&P GSCI Index is used to reflect commodity gains, cash was proxied using the US Treasury T-Bill Auction, and the USD index measures the value of the United States dollar relative to a basket of foreign currencies using a weighted geometric mean of the EUR(57.6%), JPY(13.6%), GBP(11.9%), CAD(9.1%), SEK(4.2%), CHF(3.6%). Crude oil proxied by WTI, which rose 28.46% during the quarter. All return data provided by Morningstar Direct as of September 30, 2023
- Long-term treasury performance measured by the Bloomberg US Treasury 20+ YR TR USD Index that fell 12.99% during the quarter. Value and growth styles proxied using the Russell 1000 Value and Growth indices which well 3.16 and 3.13% over the same period. All return data provided by Morningstar Direct as of September 30, 2023.
- The magnificent seven includes Apple, Microsoft, Meta Platforms, Amazon, Nvidia, Alphabet, and Tesla.
- Morningstar Direct as of September 30, 2023. MSCI EAFE and MSCI EM shown on a net return basis. All other indices shown on total return basis. All return data provided by Morningstar Direct as of September 30, 2023.
- Russell Top 200 TR Index 16.26% YTD, Russell Mid Cap TR USD 3.91% YTD, and Russell 2000 TR USD +2.54%. Historical perspective provided by Ned Davis Research. All return data provided by Morningstar Direct as of September 30, 2023.
- Sector returns reflect the applicable S&P 500 sector on a total return basis. All return data provided by Morningstar Direct as of September 30, 2023.
- Reuters reported in February that the 2023/2024 fiscal budget increased capital spending by 33% with capital outlays for railroads rising 48% and road transport rising 24% year-over-year.; Trading Economics reported the German Composite PMI Index below 50 for the last three consecutive months ending in September, historically a sign of economic contraction.
- U.S. Department of The Treasury, Daily Treasury Par Yield Curve Rates through September 30, 2023
- Baird Advisors Q3 Bond Market Review, October 10, 2023
- The indexes referenced are the Bloomberg US Aggregate Total Return, Bloomberg Municipal Total Return, Bloomberg Global Aggregate TR USD indexes, and the US dollar measure relative to a basket of foreign currencies using its weighted geometric mean of EUR (57.6%), JPY (13.6%), GBP (11.9%), CAD (9.1%), SEK (4.2%), CHF (3.6%). Q4 returns are for the period from 7/1/2022-9/30/2022; year-to-date (YTD) returns are from 1/1/2022 – 9/30/2022 and trailing twelve months (TTM) returns are from 10/1/2021-9/30/2022.
- Bloomberg US Corporate High Yield TR USD and Credit Suisse Leveraged Loan USD Indices. All return data provided by Morningstar Direct as of September 30, 2023.
- The indexes referenced are the FTSE Nareit Equity subsectors on a total return basis. The FTSE Nareit Equity Infrastructure TR USD Index fell 15.6% during the quarter, while the Diversified REIT index fell 13.92%. Office REITs fell 1.47% during the quarter and are down 17.41% YTD. All return data provided by Morningstar Direct as of September 30, 2023.
- OPEC Monthly Oil Market Report – September 2023; West Texas Intermediate Crude Oil Price Return from 7/1/2023 – 9/30/2023 using Morningstar Direct data.
Comparisons to any indices referenced herein are for illustrative purposes only and are not meant to imply that actual returns or volatility will be similar to the indices. Indices cannot be invested in directly. Unmanaged index returns assume reinvestment of any and all distributions and do not reflect our fees or expenses.
- The S&P 500 is a capitalization-weighted index designed to measure performance of the broad domestic economy through changes in the aggregate market value of 500 stocks representing all major industries.
- Russell 2000 consists of the 2,000 smallest U.S. companies in the Russell 3000 index.
- MSCI EAFE is an equity index which captures large and mid-cap representation across Developed Markets countries around the world, excluding the U.S. and Canada. The index covers approximately 85% of the free float-adjusted market capitalization in each country.
- MSCI Emerging Markets captures large and mid-cap representation across Emerging Markets countries. The index covers approximately 85% of the free-float adjusted market capitalization in each country.
- Bloomberg U.S. Aggregate Index covers the U.S. investment grade fixed rate bond market, with index components for government and corporate securities, mortgage pass-through securities, and asset-backed securities.
- Bloomberg U.S. Corporate High Yield Index covers the universe of fixed rate, non-investment grade debt. Eurobonds and debt issues from countries designated as emerging markets (sovereign rating of Baa1/BBB+/BBB+ and below using the middle of Moody’s, S&P, and Fitch) are excluded, but Canadian and global bonds (SEC registered) of issuers in non-EMG countries are included.
- FTSE NAREIT Equity REITs Index contains all Equity REITs not designed as Timber REITs or Infrastructure REITs.
- Bloomberg Commodity Index is calculated on an excess return basis and reflects commodity futures price movements. The index rebalances annually weighted 2/3 by trading volume and 1/3 by world production and weight-caps are applied at the commodity, sector and group level for diversification.
- The Purchasing Managers Index (PMI) The Purchasing Managers’ Index (PMI) is an index of the prevailing direction of economic trends in the manufacturing and service sectors. It consists of a diffusion index that summarizes whether market conditions are expanding, staying the same, or contracting as viewed by purchasing managers. The purpose of the PMI is to provide information about current and future business conditions to company decision-makers, analysts, and investors.
- The Federal Funds Rate is the target interest rate range set by the FOMC. This is the rate at which commercial banks borrow and lend their excess reserves to each other overnight. The FOMC sets a target federal funds rate eight times a year, based on prevailing economic conditions.
- The Federal Open Market Committee (FOMC) is the branch of the Federal Reserve System that determines the direction of monetary policy.
- Gross domestic product (GDP) is the total monetary or market value of all the finished goods and services produced within a country’s borders in a specific time period. As a broad measure of overall domestic production, it functions as a comprehensive scorecard of a given country’s economic health.
- Bloomberg 1-3 Month U.S. Treasury Bill Index is designed to measure the performance of public obligations of the U.S. Treasury that have a remaining maturity of greater than or equal to 1 month and less than 3 months.
- Bloomberg US Govt/Credit 1-3 Index is the 1-3 year component of the Bloomberg U.S. Government/Credit index, which includes securities in the Government and Credit Indices. The Government Index includes treasuries and agencies, while the credit index includes publicly issued U.S. corporate and foreign debentures and secured notes that meet specified maturity, liquidity, and quality requirements.
- ICE BofA US 3M Tbill Index is an unmanaged index that is comprised of a single U.S. Treasury issue with approximately three months to final maturity, purchased at the beginning of each month and held for one full month.
Material Risks
- Fixed Income securities are subject to interest rate risks, the risk of default and liquidity risk. U.S. investors exposed to non-U.S. fixed income may also be subject to currency risk and fluctuations.
- Cash may be subject to the loss of principal and over longer periods of time may lose purchasing power due to inflation.
- Domestic Equity can be volatile. The rise or fall in prices take place for a number of reasons including, but not limited to changes to underlying company conditions, sector or industry factors, or other macro events. These may happen quickly and unpredictably.
- International Equity can be volatile. The rise or fall in prices take place for a number of reasons including, but not limited to changes to underlying company conditions, sector or industry impacts, or other macro events. These may happen quickly and unpredictably. International equity allocations may also be impacted by currency and/or country specific risks which may result in lower liquidity in some markets.
This material is provided for informational purposes only and is not solely intended to be relied upon as a forecast, research or investment advice, and is not a recommendation, offer or solicitation to buy or sell any securities or to adopt any investment strategy. The views and strategies described may not be suitable for all investors. They also do not include all fees or expenses that may be incurred by investing in specific products. Past performance is no guarantee of future results. Investments will fluctuate and when redeemed may be worth more or less than when originally invested. You cannot invest directly in an index. The opinions expressed are subject to change as subsequent conditions vary. Advisory services offered through Thrivent Advisor Network, LLC.
This communication may include forward looking statements. Specific forward-looking statements can be identified by the fact that they do not relate strictly to historical or current facts and include, without limitation, words such as “may,” “will,” “expects,” “believes,” “anticipates,” “plans,” “estimates,” “projects,” “targets,” “forecasts,” “seeks,” “could’” or the negative of such terms or other variations on such terms or comparable terminology. These statements are not guarantees of future performance and involve risks, uncertainties, assumptions and other factors that are difficult to predict and that could cause actual results to differ materially.
The material presented includes information and opinions provided by a party not related to Thrivent Advisor Network. It has been obtained from sources deemed reliable; but no independent verification has been made, nor is its accuracy or completeness guaranteed. The opinions expressed may not necessarily represent those of Thrivent Advisor Network or its affiliates. They are provided solely for information purposes and are not to be construed as solicitations or offers to buy or sell any products, securities, or services. They also do not include all fees or expenses that may be incurred by investing in specific products. Past performance is no guarantee of future results. Investments will fluctuate and when redeemed may be worth more or less than when originally invested. You cannot invest directly in an index. The opinions expressed are subject to change as subsequent conditions vary. Thrivent Advisor Network and its affiliates accept no liability for loss or damage of any kind arising from the use of this information.
Investment advisory services offered through Thrivent Advisor Network, LLC., (herein referred to as “Thrivent”), a registered investment adviser. Clients will separately engage an unaffiliated broker-dealer or custodian to safeguard their investment advisory assets. Review the Thrivent Advisor Network Financial Planning and Consulting Services, Investment Management Services (Non-Wrap) and Wrap-Fee Program brochures (Form ADV Part 2A and 2A Appendix 1 brochures) for a full description of services, fees and expenses, available at Thriventadvisornetwork.com. Thrivent Advisor Network, LLC financial advisors may also be registered representatives of a broker-dealer to offer securities products.
Certain Thrivent Advisor Network LLC advisors may also be registered representatives of a broker-dealer to offer securities products. Advisory Persons of Thrivent provide advisory services under a “doing business as” name or may have their own legal business entities. However, advisory services are engaged exclusively through Thrivent Advisor Network, LLC, a registered investment adviser. Please visit our website www.thriventadvisornetwork.com for important disclosures.
The opinions expressed are subject to change as subsequent conditions vary. Reliance upon information in this material is at the sole discretion of the reader. International investing involves additional risks, including risks related to foreign currency, limited liquidity, government regulation and the possibility of substantial volatility due to adverse political, economic or other developments. The two main risks related to fixed income investing are interest rate risk and credit risk. Typically, when interest rates rise, there is a corresponding decline in the market value of bonds. Credit risk refers to the possibility that the issuer of the bond will not be able to make principal and interest payments. Index performance is shown for illustrative purposes only.
Advisory Persons of Thrivent provide advisory services under a “doing business as” name or may have their own legal business entities. However, advisory services are engaged exclusively through Thrivent Advisor Network, LLC, a registered investment adviser. Cedar Cove Wealth Partners and Thrivent Advisor Network, LLC are not affiliated companies. Information in this message is for the intended recipient[s] only. Please visit our website www.cedarcovewealth.com for important disclosures.
Securities offered through Purshe Kaplan Sterling Investments (“PKS”), Member FINRA/SIPC. PKS is headquartered at 80 State Street, Albany, NY 12207. PKS and Cedar Cove Wealth Partners are not affiliated companies.
