
Markets took a step back in August as sentiment shifted surrounding Fed policy
Key Observations
- Fitch downgraded the United States’ credit rating to AA+ from AAA at the start of the month.
- Market volatility continued through the month and most major asset classes experienced negative returns. Higher interest rates due to sentiment shifting to a “higher-for-longer” mentality by the Federal Reserve was a main culprit for weak performance.
- Commercial real estate has garnered a lot of headlines as the “next shoe to drop” but taking a deeper dive reveals the asset class may be more resilient than it appears on the surface.
Market Recap
Every month this year has brought major events for investors to digest, and August was no different. The month started with Fitch downgrading the United States’ credit rating to AA+ from the top-quality AAA rating. The rating agency cited “rising debt burdens” and “erosion of governance” among the key drivers behind the decision (1). While this creates noise in the short-term, historically it has not impacted longer-term asset class returns. Ultimately, most asset classes did end the month lower. Rising rates were a main driver of the lackluster results across asset classes. Favorable economic data and more positive sentiment on the potential for a soft landing, coupled with a Federal Reserve that is willing to stay higher-for-longer, fueled the interest rate move higher.
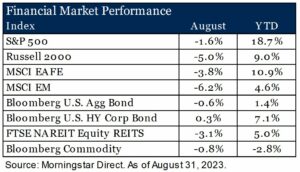
Equities, which have seen valuations move higher through the course of the year due to expectations of potential Fed rate cuts by year end, re-priced in the month as that narrative shifted to the higher-for-longer story. The S&P 500 Index fell 1.6% in August. The “Magnificent 7” (Amazon, Apple, Alphabet, Meta, Microsoft, NVIDIA, and Tesla), which had been large drivers of the index year to date, had more muted impact as only three of the seven (Amazon, Alphabet, and NVIDIA) posted positive returns in the month. Markets outside the U.S. also took a step back in August as the MSCI EAFE Index and the MSCI EM Index returned -3.8% and -6.2%, respectively. Similar themes as the U.S. played out in developed markets (MSCI EAFE) and a strengthening U.S. dollar was an added headwind. Weakness in emerging markets was further compounded by poor results in China. Deflationary concerns, weakness in the real estate market, a slower reopening from COVID-19 restrictions, and underwhelming economic activity have contributed to poor sentiment for the country.
Fixed income markets were more directly impacted by rising rates (bond prices move inversely to interest rates) with the Bloomberg U.S. Aggregate Bond Index returning -0.6%. The U.S. 10-year Treasury yield touched 4.3% during the month before settling in at 4.1%. The less rate-sensitive corporate high yield market produced a modest positive return (+0.3%) with spreads tightening following an initial widening after the U.S. downgrade. Real assets, such as commodities and REITs, declined as well. Within commodities, industrial metals were a weak point while retail and lodging were underperformers in the REIT market. The office component held up better than other sub-sectors despite the unfavorable headlines the sector has been garnering this year.
Commercial Real Estate – The Next Shoe to Drop?
The commercial real estate market, and in particular the office sub-sector, has fallen into the crosshairs this year. Interest rate hikes by the Federal Reserve and higher borrowing costs, fears of an economic slowdown, and the regional banking crisis earlier in the year have all been drivers of the pessimism. On the surface, these factors warrant negative sentiment, but if we dive a bit deeper the asset class may be more resilient than headlines suggest.
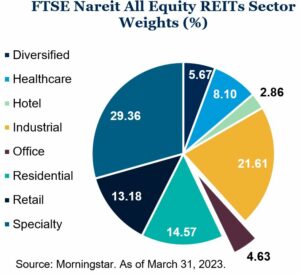
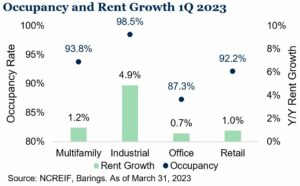
The post-pandemic hybrid and work-from-home environment has pressured the office market as investors ponder the uncertainty of future demand. However, the office sector accounts for only a fraction of the real estate market. Office is less than five percent of the publicly traded REIT market. The private real estate market has a larger weight to office (approximately 23 percent) (2). Despite the larger exposure on the private side, not all office properties are created equal. Medical office and Life Science office have been resilient. Fundamentals in other areas of the commercial real estate market remain favorable as well, with occupancy rates above 90 percent and positive year-over-year rent growth (3).
Central bank action and higher interest rates have resulted in more expensive borrowing costs and higher discount rates. Coupled with concerns of a slowing economy, this has led to worries of refinancing debt. While this environment does create headwinds for maturing real estate debt, only 16 percent of the market is maturing in 2023 and office is only 4.2 percent of the total debt coming due this year. Additionally, leverage levels are below the historical average, which should help insulate properties compared to past cycles if we see further softening in the market.
The collapse of Silicon Valley Bank and the subsequent fallout in the regional banking sector sparked concern for the commercial real estate market as well, with the office sector being in focus once again. The majority of loans come from various lender types such as agency MBS, CMBS, CDOs, and life insurance companies, while regional banks only account for 32 percent of the loans issued in the commercial real estate market (4). These loans are widely spread over 4,000 regional and community banks so the fallout of a few would likely have minimal impact on the entire market.
The commercial real estate market has come under pressure, and we may continue to see pockets of weakness in the near term. However, the asset class may be more resilient than headlines suggest as broader fundamentals remain healthy across a variety of property types, reginal banks’ commercial real estate exposure is overstated, and the office sector is just a small piece of the overall market.
Outlook
Despite the market struggling in August, the broader economic backdrop remains resilient. The Federal Reserve, as we have been hinting, is likely close to the end of the hiking cycle, as inflation has moderated from multi-decade highs. While volatility may continue, we believe portfolio allocations are thoughtfully constructed to provide resiliency and positioned to help investors meet long-term objectives in a variety of market scenarios.
Footnotes
- Fitch Rating Action Commentary, August 1, 2023
- NCREIF, March 31, 2023
- NCREIF Barings, March 31, 2023
- Washington Post, Quarterly Financial Accounts of the United States, March 10, 2023.
Disclosures & Definitions
Comparisons to any indices referenced herein are for illustrative purposes only and are not meant to imply that actual returns or volatility will be similar to the indices. Indices cannot be invested in directly. Unmanaged index returns assume reinvestment of any and all distributions and do not reflect our fees or expenses.
- The S&P 500 is a capitalization-weighted index designed to measure performance of the broad domestic economy through changes in the aggregate market value of 500 stocks representing all major industries.
- Russell 2000 consists of the 2,000 smallest U.S. companies in the Russell 3000 index.
- MSCI EAFE is an equity index which captures large and mid-cap representation across Developed Markets countries around the world, excluding the U.S. and Canada. The index covers approximately 85% of the free float-adjusted market capitalization in each country.
- MSCI Emerging Markets captures large and mid-cap representation across Emerging Markets countries. The index covers approximately 85% of the free-float adjusted market capitalization in each country.
- Bloomberg U.S. Aggregate Index covers the U.S. investment grade fixed rate bond market, with index components for government and corporate securities, mortgage pass-through securities, and asset-backed securities.
- Bloomberg U.S. Corporate High Yield Index covers the universe of fixed rate, non-investment grade debt. Eurobonds and debt issues from countries designated as emerging markets (sovereign rating of Baa1/BBB+/BBB+ and below using the middle of Moody’s, S&P, and Fitch) are excluded, but Canadian and global bonds (SEC registered) of issuers in non-EMG countries are included.
- FTSE NAREIT Equity REITs Index contains all Equity REITs not designed as Timber REITs or Infrastructure REITs.
- Bloomberg Commodity Index is calculated on an excess return basis and reflects commodity futures price movements. The index rebalances annually weighted 2/3 by trading volume and 1/3 by world production and weight-caps are applied at the commodity, sector and group level for diversification.
- A collateralized debt obligation (CDO) is a complex structured finance product that is backed by a pool of loans and other assets. These underlying assets serve as collateral if the loan goes into default. The tranches of CDOs indicate the level of risk in the underlying loans, with senior tranches having the lowest risk.
- Commercial mortgage-backed securities (CMBS) are fixed-income investment products that are backed by mortgages on commercial properties rather than residential real estate.
- Mortgage-backed securities (MBS) are investment products similar to bonds. Each MBS consists of a bundle of home loans and other real estate debt bought from the banks that issued them. Investors in mortgage-backed securities receive periodic payments similar to bond coupon payments.
- The National Council of Real Estate Investment Fiduciaries (NCREIF) serves the institutional real estate investment community as its Data Central, representing the largest, most robust and diverse database of country-specific real estate assets in the world.
Material Risks
- Fixed Income securities are subject to interest rate risks, the risk of default and liquidity risk. U.S. investors exposed to non-U.S. fixed income may also be subject to currency risk and fluctuations.
- Cash may be subject to the loss of principal and over longer periods of time may lose purchasing power due to inflation.
- Domestic Equity can be volatile. The rise or fall in prices take place for a number of reasons including, but not limited to changes to underlying company conditions, sector or industry factors, or other macro events. These may happen quickly and unpredictably.
- International Equity can be volatile. The rise or fall in prices take place for a number of reasons including, but not limited to changes to underlying company conditions, sector or industry impacts, or other macro events. These may happen quickly and unpredictably. International equity allocations may also be impact by currency and/or country specific risks which may result in lower liquidity in some markets.
- Real Assets can be volatile and may include asset segments that may have greater volatility than investment in traditional equity securities. Such volatility could be influenced by a myriad of factors including, but not limited to overall market volatility, changes in interest rates, political and regulatory developments, or other exogenous events like weather or natural disaster.
- Private Real Estate involves higher risk and is suitable only for sophisticated investors. Real estate assets can be volatile and may include unique risks to the asset class like leverage and/or industry, sector or geographical concentration. Declines in real estate value may take place for a number of reasons including, but are not limited to economic conditions, change in condition of the underlying property or defaults by the borrow.
This material is provided for informational purposes only and is not solely intended to be relied upon as a forecast, research or investment advice, and is not a recommendation, offer or solicitation to buy or sell any securities or to adopt any investment strategy. The views and strategies described may not be suitable for all investors. They also do not include all fees or expenses that may be incurred by investing in specific products. Past performance is no guarantee of future results. Investments will fluctuate and when redeemed may be worth more or less than when originally invested. You cannot invest directly in an index. The opinions expressed are subject to change as subsequent conditions vary. Advisory services offered through Thrivent Advisor Network, LLC.
This communication may include forward looking statements. Specific forward-looking statements can be identified by the fact that they do not relate strictly to historical or current facts and include, without limitation, words such as “may,” “will,” “expects,” “believes,” “anticipates,” “plans,” “estimates,” “projects,” “targets,” “forecasts,” “seeks,” “could’” or the negative of such terms or other variations on such terms or comparable terminology. These statements are not guarantees of future performance and involve risks, uncertainties, assumptions and other factors that are difficult to predict and that could cause actual results to differ materially.
The material presented includes information and opinions provided by a party not related to Thrivent Advisor Network. It has been obtained from sources deemed reliable; but no independent verification has been made, nor is its accuracy or completeness guaranteed. The opinions expressed may not necessarily represent those of Thrivent Advisor Network or its affiliates. They are provided solely for information purposes and are not to be construed as solicitations or offers to buy or sell any products, securities, or services. They also do not include all fees or expenses that may be incurred by investing in specific products. Past performance is no guarantee of future results. Investments will fluctuate and when redeemed may be worth more or less than when originally invested. You cannot invest directly in an index. The opinions expressed are subject to change as subsequent conditions vary. Thrivent Advisor Network and its affiliates accept no liability for loss or damage of any kind arising from the use of this information.
Investment advisory services offered through Thrivent Advisor Network, LLC., (herein referred to as “Thrivent”), a registered investment adviser. Clients will separately engage an unaffiliated broker-dealer or custodian to safeguard their investment advisory assets. Review the Thrivent Advisor Network Financial Planning and Consulting Services, Investment Management Services (Non-Wrap) and Wrap-Fee Program brochures (Form ADV Part 2A and 2A Appendix 1 brochures) for a full description of services, fees and expenses, available at Thriventadvisornetwork.com. Thrivent Advisor Network, LLC financial advisors may also be registered representatives of a broker-dealer to offer securities products.
Certain Thrivent Advisor Network LLC advisors may also be registered representatives of a broker-dealer to offer securities products. Advisory Persons of Thrivent provide advisory services under a “doing business as” name or may have their own legal business entities. However, advisory services are engaged exclusively through Thrivent Advisor Network, LLC, a registered investment adviser. Please visit our website www.thriventadvisornetwork.com for important disclosures.
The opinions expressed are subject to change as subsequent conditions vary. Reliance upon information in this material is at the sole discretion of the reader. International investing involves additional risks, including risks related to foreign currency, limited liquidity, government regulation and the possibility of substantial volatility due to adverse political, economic or other developments. The two main risks related to fixed income investing are interest rate risk and credit risk. Typically, when interest rates rise, there is a corresponding decline in the market value of bonds. Credit risk refers to the possibility that the issuer of the bond will not be able to make principal and interest payments. Index performance is shown for illustrative purposes only.
Advisory Persons of Thrivent provide advisory services under a “doing business as” name or may have their own legal business entities. However, advisory services are engaged exclusively through Thrivent Advisor Network, LLC, a registered investment adviser. Cedar Cove Wealth Partners and Thrivent Advisor Network, LLC are not affiliated companies. Information in this message is for the intended recipient[s] only. Please visit our website www.cedarcovewealth.com for important disclosures.
Securities offered through Purshe Kaplan Sterling Investments (“PKS”), Member FINRA/SIPC. PKS is headquartered at 80 State Street, Albany, NY 12207. PKS and Cedar Cove Wealth Partners are not affiliated companies.
