
Market Recap
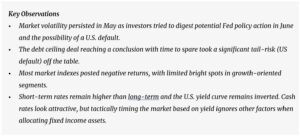
We’ve highlighted the theme of persistent heightened market volatility in many of our market reviews this year and May continued to deliver on that premise. Financial markets finally started to digest the regional banking turmoil from earlier in the year, a better-than-expected earnings season and a concentrated growth rally fueled by optimism in the AI industry helped propel U.S. equities for the first half of the month.
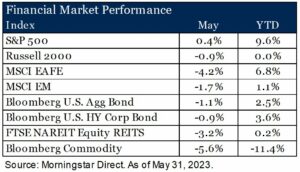
However, as the month progressed, concerns of the U.S. Treasury running out of money in June had heated up and a shift in sentiment where investors expected further hawkish actions from the Fed stalled markets. Economic data trended a bit lower with weaker manufacturing PMI numbers reported from China and the U.S., increasing investor concerns of slower economic activity in the back half of the year and fueling the selloff in equities toward the end of the month. A stronger dollar was an additional headwind for non-U.S. investments. More economically sensitive areas such as REITs and commodities also came under pressure. REITs continue to be driven lower by the office segment while a reduced outlook for global demand weighed on commodity prices.
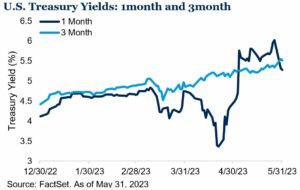
Fixed income markets were negatively impacted by rising interest rates and additional volatility on the front end of the U.S. yield curve was sparked by growing concerns of potential default if Congress did not come to an agreement to raise the debt limit. The yield on 1-month Treasury bills spiked early in the month as a result, but settled back as negotiations took an optimistic turn for a deal to be reached by the June 5 “x-date” in the last few days of the month. This optimistic view held true, as on June 1st, the US Senate passed a bill which suspended the debt ceiling until 2025. The bipartisan bill included items such as non-defense spending remaining flat in 2024, funding cuts to the IRS, and a resumption to student debt payments later this summer. Social Security, Medicare, veteran’s healthcare, and renewable energy provisions in the Inflation Reduction Act remained untouched (1).
Is Cash the Best Place to Be?
The U.S. yield curve remains inverted as investors are more concerned about economic risks in the near-term than the long-term. In the current interest rate environment – short-term rates higher than long-term rates – there are many wondering “why invest in longer duration assets when cash yields more?” At the surface the answer seems obvious, invest in the higher yielding asset, but there are more factors to consider than just yield itself. Time horizon and the investment objective for the assets, to name a few, are other important elements to evaluate. Cash can certainly have a place in portfolios for investors that have short-term needs where protecting principal is paramount but, for a more typical horizon over multiple years, cash often proves suboptimal as bonds tend to provide higher total returns over the long-term. In fact, since 1978, the Bloomberg Aggregate Bond Index outperforms cash (as measured by the ICE BofA US 3M TBill Index) approximately 67% of the time on a rolling 1-year basis and that figure jumps to 89% if we expand the rolling period to three years (2).
If positioning in cash is less focused on the long-term and more about the potential change in interest rates, we would also suggest evaluating that stance. We do not believe in timing interest rates, but we feel we are closer to the end of this interest rate hiking cycle than the beginning. Historically the prospects for traditional fixed income compared to cash when rates peak looks appealing. Following the month of the peak Fed Funds Rate, longer duration fixed income assets have outperformed cash over the following year, often by a wide margin.
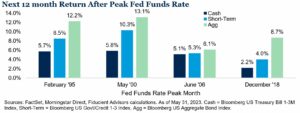
Finally, in our April Market Review we highlighted the growing risk of economic contraction. Having exposure to high quality duration may be beneficial in a flight to quality environment to help diversify the portfolio. Since 1990, bonds have outperformed cash 67% of the time if the S&P 500 Index falls 15% or more peak-to-trough, with an average margin of outperformance of 1.6% (3). We often say cash is good at protecting itself since it is stable in both up and down markets. However, bonds may be better at protecting the portfolio as they have often performed their best when risk assets perform their worst.
Outlook
Uncertainty is a large underpinning of what drives volatility in markets. With the passing of a debt ceiling agreement, the rising prospect of a slowing business cycle is now at the forefront of investors’ minds. Our views and themes of continued volatility as we move into a new interest rate regime and moderating inflation remain intact. We believe our long-term strategic views and positioning updates at the beginning of the year reinforce the foundations of our portfolios as we move into the back half of the year in an environment with tighter financial conditions.
For more information, please contact any of the professionals at Cedar Cove Wealth Partners.
Footnotes
- Senate Approves Deal Raising Debt Ceiling, June 2, 2023
- Morningstar Direct As of May 31, 2023
- Factset, Yardeni Research, Morningstar Direct. Data from January 1990 to October 2022.
Comparisons to any indices referenced herein are for illustrative purposes only and are not meant to imply that actual returns or volatility will be similar to the indices. Indices cannot be invested in directly. Unmanaged index returns assume reinvestment of any and all distributions and do not reflect our fees or expenses.
- The S&P 500 is a capitalization-weighted index designed to measure performance of the broad domestic economy through changes in the aggregate market value of 500 stocks representing all major industries.
- Russell 2000 consists of the 2,000 smallest U.S. companies in the Russell 3000 index.
- MSCI EAFE is an equity index which captures large and mid-cap representation across Developed Markets countries around the world, excluding the U.S. and Canada. The index covers approximately 85% of the free float-adjusted market capitalization in each country.
- MSCI Emerging Markets captures large and mid-cap representation across Emerging Markets countries. The index covers approximately 85% of the free-float adjusted market capitalization in each country.
- Bloomberg U.S. Aggregate Index covers the U.S. investment grade fixed rate bond market, with index components for government and corporate securities, mortgage pass-through securities, and asset-backed securities.
- Bloomberg U.S. Corporate High Yield Index covers the universe of fixed rate, non-investment grade debt. Eurobonds and debt issues from countries designated as emerging markets (sovereign rating of Baa1/BBB+/BBB+ and below using the middle of Moody’s, S&P, and Fitch) are excluded, but Canadian and global bonds (SEC registered) of issuers in non-EMG countries are included.
- FTSE NAREIT Equity REITs Index contains all Equity REITs not designed as Timber REITs or Infrastructure REITs.
- Bloomberg Commodity Index is calculated on an excess return basis and reflects commodity futures price movements. The index rebalances annually weighted 2/3 by trading volume and 1/3 by world production and weight-caps are applied at the commodity, sector and group level for diversification.
- The Purchasing Managers Index (PMI) The Purchasing Managers’ Index (PMI) is an index of the prevailing direction of economic trends in the manufacturing and service sectors. It consists of a diffusion index that summarizes whether market conditions are expanding, staying the same, or contracting as viewed by purchasing managers. The purpose of the PMI is to provide information about current and future business conditions to company decision-makers, analysts, and investors.
- The Federal Funds Rate is the target interest rate range set by the FOMC. This is the rate at which commercial banks borrow and lend their excess reserves to each other overnight. The FOMC sets a target federal funds rate eight times a year, based on prevailing economic conditions.
- The Federal Open Market Committee (FOMC) is the branch of the Federal Reserve System that determines the direction of monetary policy.
- Gross domestic product (GDP) is the total monetary or market value of all the finished goods and services produced within a country’s borders in a specific time period. As a broad measure of overall domestic production, it functions as a comprehensive scorecard of a given country’s economic health.
- Bloomberg 1-3 Month U.S. Treasury Bill Index is designed to measure the performance of public obligations of the U.S. Treasury that have a remaining maturity of greater than or equal to 1 month and less than 3 months.
- Bloomberg US Govt/Credit 1-3 Index is the 1-3 year component of the Bloomberg U.S. Government/Credit index, which includes securities in the Government and Credit Indices. The Government Index includes treasuries and agencies, while the credit index includes publicly issued U.S. corporate and foreign debentures and secured notes that meet specified maturity, liquidity, and quality requirements.
- ICE BofA US 3M Tbill Index is an unmanaged index that is comprised of a single U.S. Treasury issue with approximately three months to final maturity, purchased at the beginning of each month and held for one full month.
Material Risks
- Fixed Income securities are subject to interest rate risks, the risk of default and liquidity risk. U.S. investors exposed to non-U.S. fixed income may also be subject to currency risk and fluctuations.
- Cash may be subject to the loss of principal and over longer periods of time may lose purchasing power due to inflation.
- Domestic Equity can be volatile. The rise or fall in prices take place for a number of reasons including, but not limited to changes to underlying company conditions, sector or industry factors, or other macro events. These may happen quickly and unpredictably.
- International Equity can be volatile. The rise or fall in prices take place for a number of reasons including, but not limited to changes to underlying company conditions, sector or industry impacts, or other macro events. These may happen quickly and unpredictably. International equity allocations may also be impacted by currency and/or country specific risks which may result in lower liquidity in some markets.
This material is provided for informational purposes only and is not solely intended to be relied upon as a forecast, research or investment advice, and is not a recommendation, offer or solicitation to buy or sell any securities or to adopt any investment strategy. The views and strategies described may not be suitable for all investors. They also do not include all fees or expenses that may be incurred by investing in specific products. Past performance is no guarantee of future results. Investments will fluctuate and when redeemed may be worth more or less than when originally invested. You cannot invest directly in an index. The opinions expressed are subject to change as subsequent conditions vary. Advisory services offered through Thrivent Advisor Network, LLC.
This communication may include forward looking statements. Specific forward-looking statements can be identified by the fact that they do not relate strictly to historical or current facts and include, without limitation, words such as “may,” “will,” “expects,” “believes,” “anticipates,” “plans,” “estimates,” “projects,” “targets,” “forecasts,” “seeks,” “could’” or the negative of such terms or other variations on such terms or comparable terminology. These statements are not guarantees of future performance and involve risks, uncertainties, assumptions and other factors that are difficult to predict and that could cause actual results to differ materially.
The material presented includes information and opinions provided by a party not related to Thrivent Advisor Network. It has been obtained from sources deemed reliable; but no independent verification has been made, nor is its accuracy or completeness guaranteed. The opinions expressed may not necessarily represent those of Thrivent Advisor Network or its affiliates. They are provided solely for information purposes and are not to be construed as solicitations or offers to buy or sell any products, securities, or services. They also do not include all fees or expenses that may be incurred by investing in specific products. Past performance is no guarantee of future results. Investments will fluctuate and when redeemed may be worth more or less than when originally invested. You cannot invest directly in an index. The opinions expressed are subject to change as subsequent conditions vary. Thrivent Advisor Network and its affiliates accept no liability for loss or damage of any kind arising from the use of this information.
Investment advisory services offered through Thrivent Advisor Network, LLC., (herein referred to as “Thrivent”), a registered investment adviser. Clients will separately engage an unaffiliated broker-dealer or custodian to safeguard their investment advisory assets. Review the Thrivent Advisor Network Financial Planning and Consulting Services, Investment Management Services (Non-Wrap) and Wrap-Fee Program brochures (Form ADV Part 2A and 2A Appendix 1 brochures) for a full description of services, fees and expenses, available at Thriventadvisornetwork.com. Thrivent Advisor Network, LLC financial advisors may also be registered representatives of a broker-dealer to offer securities products.
Certain Thrivent Advisor Network LLC advisors may also be registered representatives of a broker-dealer to offer securities products. Advisory Persons of Thrivent provide advisory services under a “doing business as” name or may have their own legal business entities. However, advisory services are engaged exclusively through Thrivent Advisor Network, LLC, a registered investment adviser. Please visit our website www.thriventadvisornetwork.com for important disclosures.
The opinions expressed are subject to change as subsequent conditions vary. Reliance upon information in this material is at the sole discretion of the reader. International investing involves additional risks, including risks related to foreign currency, limited liquidity, government regulation and the possibility of substantial volatility due to adverse political, economic or other developments. The two main risks related to fixed income investing are interest rate risk and credit risk. Typically, when interest rates rise, there is a corresponding decline in the market value of bonds. Credit risk refers to the possibility that the issuer of the bond will not be able to make principal and interest payments. Index performance is shown for illustrative purposes only.
Advisory Persons of Thrivent provide advisory services under a “doing business as” name or may have their own legal business entities. However, advisory services are engaged exclusively through Thrivent Advisor Network, LLC, a registered investment adviser. Cedar Cove Wealth Partners and Thrivent Advisor Network, LLC are not affiliated companies. Information in this message is for the intended recipient[s] only. Please visit our website www.cedarcovewealth.com for important disclosures.
Securities offered through Purshe Kaplan Sterling Investments (“PKS”), Member FINRA/SIPC. PKS is headquartered at 80 State Street, Albany, NY 12207. PKS and Cedar Cove Wealth Partners are not affiliated companies.
