
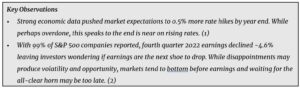
While markets retreat, the shift in rate expectations show signs the end of rate hikes is near.
Market Recap
Warm winter weather seems to have fueled hot January economic data reported in February. Employment, retail sales, manufacturing, and inflation all showed acceleration. Markets fell in sympathy. Why? The irony of positive economic surprises is that markets interpret such news as meaning the Fed has more rate hikes ahead. We’ll unpack more of the details below.
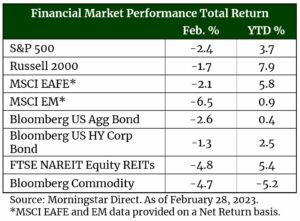
For the month, markets were broadly down across most major asset classes. Domestic markets, particularly growth, held up based on the rally in semi-conductors and China pulled down ex-U.S. markets following its extraordinary rally from October of last year. Malaise around U.S. – China relations and an attempt to gauge the degree to which Chinese consumers will emerge from COVID lockdowns had some investors taking profits.
Markets Swallow Upside Surprise on Economic Data Whole
February brought a rush of positive economic data. Unemployment fell to 3.4% (the lowest since 1969) coupled with a blockbuster 517,000 jobs added in January. Personal income grew 0.6% in January coupled with retail sales showing a very strong January growth of 3%. Strong employment and spending figures translated to inflation accelerating in January up 0.5% compared to a more temperate increase of 0.1% in December. (3) Our take, while good news, is there may be some noise in these figures that may make them rosier than they appear. For example, seasonal layoffs did not occur nearly to the same degree as they have in the past based on the struggles of businesses to fill open positions, so employment surprised to the upside. Or perhaps the 8.7% cost-of-living adjustment for Social Security and/or the drop in in consumer savings rates may have boosted spending in an unsustainable way. Regardless, markets swallowed these figures whole and shifted their view on the Fed.
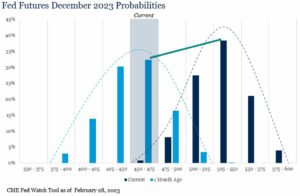
The graphic above shows probabilities of where the Fed Funds rate will end in December 2023, according to the market. One month ago, there was only a 16% probability rates would be higher than 4.5% – 4.75% by year-end. That figure is now 99%. This shift in sentiment has dampened market expectations for a Fed pause / pivot. While perhaps overdone based on the seasonal noise we mentioned, it does speak to the end of rate hikes being near. An unexpected acceleration across several economic fronts shifted expectations 0.50% over 10 months. Last year over the same 10 months from March to December rates rose 4.25%, a 1600% increase. Another 0.50% until December would be an 11% increase. We view rates peaking as a positive step for markets to find their sustainable leg up and we are nearing that point.
Are Earnings the Next Shoe to Drop?
If it is not rates, what is the next shoe for markets? With 99% of companies having reported for the fourth quarter 2022, earnings may sneak away with a positive increase for the year. This is well short of expectations (10%+) and only positive after being bailed out by a very strong year in the energy sector. As of March 3, Q4 2022 earnings declined -4.6%. If that is where earnings finish it will be the worst quarter since Q3 2020 when earnings declined -5.7%, a time when businesses were reeling from shelter-in-place COVID policies (2). So does this become the next shoe to drop for markets? It is possible that in the coming quarters disappointing earnings could lead to market volatility as the impact of rates and inflation catch up. However, as we discussed in our 2023 Outlook market volatility should be expected as businesses adjust to non-zero rates and a less accommodative central bank policy.
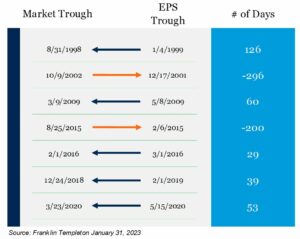
Moreover, even if we could perfectly time the earnings cycle (which no one can), markets tend to move ahead of earnings seeking to anticipate their eventual bottom. Since 1998 markets have led earnings in five of seven drawbacks. In those instances, on average markets have bottomed 61 days prior to earnings. In summary, for investors that wait for the all-clear horn on earnings to sound they may end up missing the market bottom.
Outlook
We believe continued volatility, moderating inflation, and a market bottom leading to better returns ahead than in 2022 will remain key drivers for the market. The shift in market sentiment around the Fed, while perhaps overdone, speaks to the end is near for rates. This is important in our view for markets to bottom. Earnings may create volatility, but they also create opportunities and are a regular part of the growth and consolidate cycle. Finally, inflation, which we’ll unpack in a separate market review coming soon, we believe continues to trend in the right direction. Therefore, our view remains that without the power of precision we’ll use the power of preparation to position portfolios for both volatility and opportunity in 2023.
For more information, please contact any of the professionals at Cedar Cove Wealth Partners.
Footnotes
- CME Group March, Fed Target Probabilities, February 28, 2023
- FactSet Earnings Insight as of March 3, 2023
- U.S. Bureau of Labor Statistics as of February 28, 2023
Comparisons to any indices referenced herein are for illustrative purposes only and are not meant to imply that actual returns or volatility will be similar to the indices. Indices cannot be invested in directly. Unmanaged index returns assume reinvestment of any and all distributions and do not reflect our fees or expenses.
- The S&P 500 is a capitalization-weighted index designed to measure performance of the broad domestic economy through changes in the aggregate market value of 500 stocks representing all major industries.
- Russell 2000 consists of the 2,000 smallest U.S. companies in the Russell 3000 index.
- MSCI EAFE is an equity index which captures large and mid-cap representation across Developed Markets countries around the world, excluding the U.S. and Canada. The index covers approximately 85% of the free float-adjusted market capitalization in each country.
- MSCI Emerging Markets captures large and mid-cap representation across Emerging Markets countries. The index covers approximately 85% of the free-float adjusted market capitalization in each country.
- Bloomberg U.S. Aggregate Index covers the U.S. investment grade fixed rate bond market, with index components for government and corporate securities, mortgage pass-through securities, and asset-backed securities.
- Bloomberg U.S. Corporate High Yield Index covers the universe of fixed rate, non-investment grade debt. Eurobonds and debt issues from countries designated as emerging markets (sovereign rating of Baa1/BBB+/BBB+ and below using the middle of Moody’s, S&P, and Fitch) are excluded, but Canadian and global bonds (SEC registered) of issuers in non-EMG countries are included.
- FTSE NAREIT Equity REITs Index contains all Equity REITs not designed as Timber REITs or Infrastructure REITs.
- Bloomberg Commodity Index is calculated on an excess return basis and reflects commodity futures price movements. The index rebalances annually weighted 2/3 by trading volume and 1/3 by world production and weight-caps are applied at the commodity, sector and group level for diversification.
This material is provided for informational purposes only and is not solely intended to be relied upon as a forecast, research or investment advice, and is not a recommendation, offer or solicitation to buy or sell any securities or to adopt any investment strategy. The views and strategies described may not be suitable for all investors. They also do not include all fees or expenses that may be incurred by investing in specific products. Past performance is no guarantee of future results. Investments will fluctuate and when redeemed may be worth more or less than when originally invested. You cannot invest directly in an index. The opinions expressed are subject to change as subsequent conditions vary. Advisory services offered through Thrivent Advisor Network, LLC.
This communication may include forward looking statements. Specific forward-looking statements can be identified by the fact that they do not relate strictly to historical or current facts and include, without limitation, words such as “may,” “will,” “expects,” “believes,” “anticipates,” “plans,” “estimates,” “projects,” “targets,” “forecasts,” “seeks,” “could’” or the negative of such terms or other variations on such terms or comparable terminology. These statements are not guarantees of future performance and involve risks, uncertainties, assumptions and other factors that are difficult to predict and that could cause actual results to differ materially.
The material presented includes information and opinions provided by a party not related to Thrivent Advisor Network. It has been obtained from sources deemed reliable; but no independent verification has been made, nor is its accuracy or completeness guaranteed. The opinions expressed may not necessarily represent those of Thrivent Advisor Network or its affiliates. They are provided solely for information purposes and are not to be construed as solicitations or offers to buy or sell any products, securities, or services. They also do not include all fees or expenses that may be incurred by investing in specific products. Past performance is no guarantee of future results. Investments will fluctuate and when redeemed may be worth more or less than when originally invested. You cannot invest directly in an index. The opinions expressed are subject to change as subsequent conditions vary. Thrivent Advisor Network and its affiliates accept no liability for loss or damage of any kind arising from the use of this information.
Investment advisory services offered through Thrivent Advisor Network, LLC., (herein referred to as “Thrivent”), a registered investment adviser. Clients will separately engage an unaffiliated broker-dealer or custodian to safeguard their investment advisory assets. Review the Thrivent Advisor Network Financial Planning and Consulting Services, Investment Management Services (Non-Wrap) and Wrap-Fee Program brochures (Form ADV Part 2A and 2A Appendix 1 brochures) for a full description of services, fees and expenses, available at Thriventadvisornetwork.com. Thrivent Advisor Network, LLC financial advisors may also be registered representatives of a broker-dealer to offer securities products.
Certain Thrivent Advisor Network LLC advisors may also be registered representatives of a broker-dealer to offer securities products. Advisory Persons of Thrivent provide advisory services under a “doing business as” name or may have their own legal business entities. However, advisory services are engaged exclusively through Thrivent Advisor Network, LLC, a registered investment adviser. Please visit our website www.thriventadvisornetwork.com for important disclosures.
The opinions expressed are subject to change as subsequent conditions vary. Reliance upon information in this material is at the sole discretion of the reader. International investing involves additional risks, including risks related to foreign currency, limited liquidity, government regulation and the possibility of substantial volatility due to adverse political, economic or other developments. The two main risks related to fixed income investing are interest rate risk and credit risk. Typically, when interest rates rise, there is a corresponding decline in the market value of bonds. Credit risk refers to the possibility that the issuer of the bond will not be able to make principal and interest payments. Index performance is shown for illustrative purposes only.
Advisory Persons of Thrivent provide advisory services under a “doing business as” name or may have their own legal business entities. However, advisory services are engaged exclusively through Thrivent Advisor Network, LLC, a registered investment adviser. Cedar Cove Wealth Partners and Thrivent Advisor Network, LLC are not affiliated companies. Information in this message is for the intended recipient[s] only. Please visit our website www.cedarcovewealth.com for important disclosures.
Securities offered through Purshe Kaplan Sterling Investments (“PKS”), Member FINRA/SIPC. PKS is headquartered at 80 State Street, Albany, NY 12207. PKS and Cedar Cove Wealth Partners are not affiliated companies.
