
3rd Quarter Summary and Market Considerations
The key factors that dominated capital markets in the first half of the year maintained their relevance in the third quarter, despite the optimism offered by the bear market rally in July. Arguably, the largest factor that drove investment returns in the third quarter was the Federal Reserve, followed closely by inflation, labor market conditions, and a strengthening US dollar. Though these themes can be separated conceptually, untangling their relationship with each other remains both a challenge as well as an opportunity.
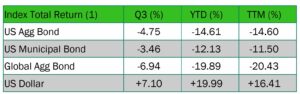
In June, the Fed surprised investors with their first 75 bps rate hike in the current cycle, only to follow it up with matching hikes in July and September. Prior to the September hike, Chairman Powell gave a brief speech at the Fed’s annual symposium in Jackson Hole that removed the majority of hope held by bond investors regarding a dovish policy pivot. While rates had traded relatively flat for the quarter up until that moment in late August, the 10-year yield gained nearly a full percent through the end of the quarter, pushing domestic and global bond prices lower and the USD higher (2). The Bloomberg US Aggregate index lost 4.8% bringing YTD losses to 14.6%. Global yields followed US Treasury yields higher as most G20 (3) central banks raised their target rates, though often at a more tempered pace. This difference in policy decisions contributed to the Global Aggregate Bond index losing 6.9% while the USD gained more than 7% as sovereign spreads widened relative to US Treasuries (4). Idiosyncratic risks across the world tied to the conflict in Ukraine and higher energy costs, as well as China’s ongoing struggle to contain COVID-19, were also factors that drove investors to the safety of the USD last quarter.
While a rising fed funds rate was one factor, core price pressures in the US reached new cyclical highs as unemployment remained at a 50-year low of 3.5% and average hourly wages gained 5.8% (5). Despite a 10.1% decline in monthly job openings in August, the second largest decline ever, the ratio of job openings to job seekers remained elevated at 1.7x (6) For context, prior to March 2018, this ratio had never exceeded 1x, a level that would require 3-4 million job openings to be filled or pulled to get back to the long-term average. Adding to the Fed’s list of reasons to continue hiking rates, weekly unemployment claims remained historically low as secular trends supporting a tight labor market (reshoring, employer position hoarding, and the Inflation Reduction Act) came into focus.
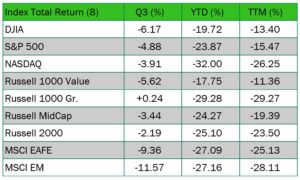
Collectively, the visible path to higher rates left equity prices and valuation multiples lower for the quarter with value stocks underperforming growth by nearly 6% and small caps outperforming large caps by more than 2.5% (7). Year-to-date trends remained intact despite the quarterly reversal with value stocks ending slightly above bear market territory, though still well ahead of growth stocks, and large caps retaining a modest lead over mid- and small cap equities.
International equities fared no better with developed markets declining 9.4% and emerging markets giving back 11.6%. However, in local currency terms foreign equities easily outperformed. For example, English investors lost only 1.3% while Japanese investors gave back just -7.1% compared to American investors who ceded -17.3% and -19%, respectively in each market over the past quarter (9). While international markets generally contended with rising prices and interest rates similar to changes experienced in the US, the conflict in Ukraine, Europe’s energy crisis, and China’s COVID-zero policy response remained additional headwinds that weighed on performance last quarter.
Market Considerations
The speed and depth of declines this year are unlikely to be reversed by year-end, though we remain optimistic about the forthcoming recovery. While there is no one indicator that can predict the inevitable end to a bear market and subsequent ignition of a new bull market, prior market cycles offer insights into how we have prepared our present positioning. From this vantage point, we anticipate that inflation and the subsequent responses from central banks, as well as geopolitical risks and the second order effects on energy markets will remain top macroeconomic drivers. At the portfolio level, we anticipate fixed income securities resuming a more traditional role in portfolio allocations, while the direction and strength of the US dollar is likely to inform domestic and international exposures in any forthcoming expansionary cycle.
From a policy perspective, central banks will continue to remain steadfast in their efforts to contain inflation by tightening financial conditions via raising policy rates and shrinking balance sheets (QT). Domestically, we are closely monitoring the spread between the 2-year Treasury yield and fed funds
rates as historically when the two yields have crossed, monetary policy has been at or near an inflection point. Similarly, 2-year and 10-year Treasury bond yields also converge near policy inflections as investors become more confident in their estimations of future Fed policy decisions. Finally, in the post- Volker era of monetary policy, the fed funds rate has only stopped being hiked once it exceeded headline inflation (10). Given the present state of all three measures, we expect the Fed to continue hiking rates into next year and are keenly focused on the convergence of these historical indicators to continue informing fixed income portfolio positioning.
With interest rates continuing to rise and fixed income spreads widening out over Treasury benchmarks, we have tactically modified our fixed income allocations across select model portfolios (11). Within these models our credit and duration exposures underweight our strategic targets, but we do not anticipate maintaining these exposures for long given the absolute level of yields, generally strong credit fundamentals, and early evidence of broad price level appreciation slowing. Furthermore, higher interest rates reduce the need for portfolio allocations to emphasize equity exposures and their associated higher risk, as the traditional “income producing” aspect of bonds reasserts its contribution to total expected returns.
While the anticipated changes in our fixed income allocations are straight forward, similar decisions regarding the ratio of domestic to international asset classes are less clear. Despite price-to-earnings multiples and dividends yields trading at historically wide levels and entry price points that are unlikely to be seen in the next five to ten years, the ongoing conflict in Ukraine and the associated impact to energy supplies have tempered our expectations for an otherwise attractive investment opportunity. While we lack clarity around the timing of a conflict resolution, the probability of a deep recession in Germany, Europe’s largest economy, continues to rise as winter approaches and energy rationing plans are solidified. Adding to uncertainties, governments in the area are tasked with containing inflation while alleviating the impact that higher energy prices are having on consumers through a patchwork of fiscal policies. Collectively, we see attractive valuations reflective of significant uncertainties, not a mispricing opportunity. Though we are closely monitoring the strength of the US dollar for early indications of shifting risk sentiment, as a cyclical downturn would be a substantial tailwind for US investors.
Concluding Thoughts
Despite what has been a historically challenging year for investors, we remain optimistic about forward looking return prospects as labor market conditions continue to exude strength consistent with a soft-landing or shallow recession. While historical recessions typically see earnings decline between 20-30 percent, a soft landing or shallow recession could experience less than half that amount and similarly should recover more quickly than a traditional recession. The challenge confronting many near-term asset allocation decisions remains tied to geopolitical uncertainties, most acutely those in Ukraine and the rising tension between the US and China. Unfortunately, forecasting politics remains nearly impossible. As such, we will continue to assess investment opportunities based on measurable outcomes and the likelihood of unknowns, as we seek investment returns adequately compensated for a given level of risk.
As always, should you have additional questions, please reach out to any of the professionals at Cedar Cove Wealth Partners.
Endnotes
- The indexes referenced are the Bloomberg US Aggregate Total Return, Bloomberg Municipal Total Return, Bloomberg Global Aggregate TR USD indexes, and the US dollar measure relative to a basket of foreign currencies using its weighted geometric mean of EUR (57.6%), JPY (13.6%), GBP (11.9%), CAD (9.1%), SEK (4.2%), CHF (3.6%). Q3 returns are for the period from 7/1/2022-9/30/2022; year-to-date (YTD) returns are from 1/1/2022 – 9/30/2022 and trailing twelve months (TTM) returns are from 10/1/2021-9/30/2022.
- From June 30th – August 26th, the 10-year Treasury yield rose from 2.98% to 3.04%, a gain of 6 bps. However, from by September 30th, the yield rose to 3.83%, a gain of 85 bps for the entire quarters. All information quoted from the US Treasury website.
- Organization for Economic Cooperation and Development, https://data.oecd.org/interest/short-term-interest-rates.htm. China and Japan were the only two countries to not raise interest rates in the third quarter.
- Morningstar Direct, see index details in first endnote.
- United States Bureau of Labor Statistics September Employment Situation
- United States Bureau of Labor Statistics Job Openings and Labor Turnover Survey, through August 2022
- Morningstar Direct. The Russell 1000 Value Index declined 5.62% in the third quarter compared to the Russell 1o00 Growth Index that gained 0.24%, a difference of 5.86%. The Russell 2000 Index fell 2.19% in the third quarter compared to the S&P 500 that fell 4.88%, a difference of 2.69%
- Morningstar Direct and JPMorgan Guide to the Markets 09/30/2022; The MSCI EAFE and MSCI EM are reported on a net return basis while the MSCI United Kingdom and MSCI Japan index values are reported as gross return.
- All indexes referenced are shown on a total return basis for domestic indices and net return basis for foreign indices. For example, “DJIA” represents the Dow Jones Industrial Average Total Return Index. Q2 returns are for the period from 7/1/2022-9/30/2022; year-to-date (YTD) returns are from 1/1/2022 – 9/30/2022 and trailing twelve months (TTM) returns are from 10/1/2021-9/30/2022.
- St Louis Federal Reserve Fred Data, AGF Investments Investment and Market News, “The Most Important Indicator to Watch Right Now?”, David Stonehouse, 10/14/2022
- In September we modified our tactical model portfolio fixed income allocations as indicated herein. In October we shifted from an aggressive income allocation to a conservative income allocation, adjustments that reduced our credit risk and duration exposures.
Disclosures and Definitions
Index Benchmarks presented within this report may not reflect factors relevant for your portfolio or your unique risks, goals or investment objectives. Past performance of an index is not an indication or guarantee of future results. It is not possible to invest directly in an index.
- The Standard & Poor’s 500 (S&P 500) is a market-cap weighted index comprised of the common stocks of 500 leading companies in leading industries of the U.S. economy.
- The Bloomberg Global Aggregate® Index is a flagship measure of global investment grade debt from twenty-four local currency markets. This multi-currency benchmark includes treasury, government-related, corporate and securitized fixed-rate bonds from both developed and emerging markets issuers.
- The Bloomberg Municipal Bond Index is a total return performance benchmark for municipal bonds and have maturities of at least one year.
- The Bloomberg U.S. Aggregate Index covers the U.S. investment grade fixed rate bond market, with index components for government and corporate securities, mortgage pass-through securities, and asset-backed securities.
- The Nasdaq Composite Index (Nasdaq) is a market-cap weighted index of more than 3,700 stocks listed on the Nasdaq stock exchange.
- The Dow Jones Industrial Average (DJIA) is a stock market index that tracks 30 large, publicly-owned blue-chip companies trading on the New York Stock Exchange (NYSE) and the Nasdaq.
- The Russell 1000 Value index is a broadly diversified index predominantly made up of value stocks of large US companies.
- The Russell 1000 Growth index is a broadly diversified index predominantly made up of growth stocks of large US companies.
- The Russell Midcap index is a market capitalization weighted index comprised of 800 publicly traded companies with market capitalizations between $2 billion and $10 billion.
- The Russell 2000 index is a small-cap stock market index that makes up the smallest 2000 stocks in the total US market.
- The MSCI EAFE index is a stock market index designed to measure the equity market performance of developed markets outside of the US and Canada.
- The MSCI EM index is a stock market index designed to measure the equity market performance of large and mid-cap stocks in emerging markets.
- The S. Dollar Index – known as USDX, DXY, DX and USD Index – is a measure of the value of the United States Dollar (USD) against a weighted basket of currencies used by U.S. trade partners. The index will rise if the Dollar strengthens against these currencies and fall if it weakens.
- The price-to-earnings ratio (P/E ratio) is the ratio for valuing a company that measures its current share price relative to its earnings per share (EPS). The price-to-earnings ratio is also sometimes known as the price multiple or the earnings multiple.
Investment advisory services offered through Thrivent Advisor Network, LLC., a registered investment adviser and a subsidiary of Thrivent. Advisory Persons of Thrivent provide advisory services under a “doing business as” name or may have their own legal business entities. However, advisory services are engaged exclusively through Thrivent Advisor Network, LLC, a registered investment adviser. Cedar Cove Wealth Partners and Thrivent Advisor Network, LLC are not affiliated companies. Information in this message is for the intended recipient[s] only. Please visit our website www.cedarcovewealth.com for important disclosures.
The material presented includes information and opinions provided by a party not related to Thrivent Advisor Network. It has been obtained from sources deemed reliable; but no independent verification has been made, nor is its accuracy or completeness guaranteed. The opinions expressed may not necessarily represent those of Thrivent Advisor Network or its affiliates. They are provided solely for information purposes and are not to be construed as solicitations or offers to buy or sell any products, securities, or services. They also do not include all fees or expenses that may be incurred by investing in specific products. Past performance is no guarantee of future results. Investments will fluctuate and when redeemed may be worth more or less than when originally invested. You cannot invest directly in an index. The opinions expressed are subject to change as subsequent conditions vary. Thrivent Advisor Network and its affiliates accept no liability for loss or damage of any kind arising from the use of this information.
Different types of investments involve varying degrees of risk. Therefore, it should not be assumed that future performance of any specific investment or investment strategy will be profitable.
This communication may include forward looking statements. Specific forward-looking statements can be identified by the fact that they do not relate strictly to historical or current facts and include, without limitation, words such as “may,” “will,” “expects,” “believes,” “anticipates,” “plans,” “estimates,” “projects,” “targets,” “forecasts,” “seeks,” “could’” or the negative of such terms or other variations on such terms or comparable terminology. These statements are not guarantees of future performance and involve risks, uncertainties, assumptions and other factors that are difficult to predict and that could cause actual results to differ materially.
