
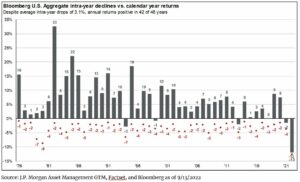
Tuesday was bad, really bad. US equity markets experienced their worst day of performance since the early days of the pandemic in 2020 as investor expectations were once again disappointed by inflation figures coming in above expectations. Adding to the storm, Treasury yields, from three-months to ten-years, rose across the term spectrum (1), putting further downward pressure on bond prices that have declined more than 4x the average intra-year drop. Rather than add to the numerous recaps available from reputable sources including the WSJ and Bloomberg, we thought it could be helpful to offer some historical context related to market lows, highlight developing investment opportunities, and share two insights from our operations team. However, before we dive in, it is important to acknowledge that investing is hard. It requires intelligence, prudence, patience, and persistence, as well as acknowledging that there are no simple solutions to complex problems. Yet for individuals who are willing to accept the risks and execute a thoughtfully crafted investment strategy, the fruits of investing can be plentiful.
Since 1958, the US stock market has bottomed in the second half of the year twelve out of thirteen times when stocks have recorded an annual loss, most frequently in October and December, and only once in the first half of the year, which coincidentally occurred in June (2,3). There are seasonal justifications to support these trends, such as holiday retail sales, below average trading volumes during the summer months, elections, earnings cycles, and more nuanced factors tied to specific events including monetary policy changes. Given the current backdrop, we remain cautious that annual stock market lows are once again likely to be established later this year, though we cannot be certain. Our primary basis for caution is tied to investors’ persistent optimism that the Fed will pivot sooner than expected as inflationary pressures ease, along with the burgeoning energy crisis facing Europe. While we feel that our caution is warranted, further declines are likely to be mild given the strength exhibited by labor markets, consumer balance sheets, and S&P 500 earnings prospects.
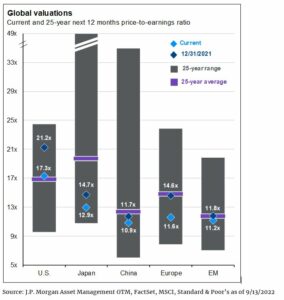
With regards to earnings, over time stock prices reflect the underlying fundamentals of a company – largely a company’s ability to generate profits or net earnings. If we look at the average price paid per dollar of earnings over the last 25-years, what investors commonly refer to as the price to earnings or P/E ratio, investors have been willing to pay about 17x forecasted earnings4. According to FactSet5, consensus earnings for 2022 are currently forecast to be about $240 per share. Consequently, by applying the historical price multiple to expected earnings, the S&P 500 should trade near 4,080, about 4% higher than where it closed on Tuesday, September 13, 2022. Alternatively, if the US economy experiences a typical run-of-the-mill recession, earnings should decline by about 25%. Annualizing second quarter reported earnings near $57 per share (5) and adjusting for a 25% decline, earnings may drop to $171 per share, supporting a S&P 500 index closer to 2,900, approximately 25% lower. One last perspective to consider would be a mild recession in which earnings drop around 10%, near $205 per share with the S&P 500 trading near 3,490, approximately 11% lower. Importantly, forecasting earnings is notoriously difficult given the impact of company specific factors, as well as broader macroeconomic trends and exogenous shocks that this year included the war in Ukraine. Nonetheless, exploring the fundamentals that support stock prices over the long-term should help establish reasonable expectations during the current bear market.
Given future uncertainties and the cost of being wrong, our process seeks to identify opportunities and cycles that can add value over time. Presently, we see two important trends in global equities and domestic bonds that are likely to influence our asset allocation decisions over the coming quarters. First, notwithstanding the loss of life, which has been terrible, and the associated economic impact, the war in Ukraine has also created opportunities. For instance, renewable energy sources are likely to be a key long-term investment across Europe as the region seeks to further reduce its dependence on energy imports. More immediately, the conflict has pushed global equity valuations in both absolute and relative terms to levels that have historically been attractive entry points for investors. While we have not yet added to our global stock positions, the opportunity to do so is being closely monitored.
Second, the decline in bond prices as yields have risen, illustrated in the first chart, has been historic. Exiting what is often referred to as the “zero-lower bound” policy environment has been painful to say the least. Nonetheless, higher yields offer investors the opportunity to generate higher future income and produce total returns that are less dependent on price appreciation alone, which should result in lower portfolio volatility (all else being equal). Over the last several quarters we have identified and taken advantage of opportunities to modify fixed income exposures. Given the dynamic environment for bonds that persists today, we anticipate more opportunities will emerge in the coming quarters.
In addition to closely monitoring attractive investment opportunities within global equities and domestic credit markets, the investment operations team is actively monitoring tax-loss harvesting opportunities and recommending strategies for clients looking to invest cash. In April this year, our team harvested unrealized capital losses, but as equity markets have continued to decline, additional opportunities are present once again (6). With regards to deploying cash positions, we anticipate prices in stocks and bonds to fall further, though current prices are a good entry point for long-term investors as we recognize that our expectations may not come to pass. Furthermore, historically some of the greatest gains are often delivered in the first six months of a new bull market. Investors that fail to participate in these gains can experience greater difficultly achieving their financial goals than those who remain invested.
This year has proven challenging for investors. Not only is the world still emerging from a pandemic, but supply chains for food and energy have been further damaged by the needless and unjustified conflict in Ukraine. Despite markets facing the near perfect storm this year, the tremendous fiscal response to COVID has provided a solid financial base for consumers and businesses that continue to support employment as well as the broader economy. While the near-term outlook remains challenging, we remain confident in the opportunities that lie before us and are grateful for the trust you have placed in our team.
As always, should you have additional questions, please reach out to any of the professionals at Cedar Cove Wealth Partners.
Endnotes
- US Department of the Treasury Daily Treasury Par Yield Curve Rates; home.treasury.gov
- DataTrek, “Market Thoughts, Down Year Q4, CPI”, September 12, 2022
- The S&P 500 recorded its most recent low on June 16, 2022
- FactSet, JP Morgan Asset Management
- FactSet Earnings Insight, September 9, 2022
- Tax loss harvesting is the process of selling a position or fund that is trading at a loss and purchasing a fund with similar exposure to maintain market exposure or holding the proceeds in cash during the wash loss period. While tax-loss harvesting can help manage capital gain tax liabilities, doing so can alter the intended investment strategy. As such, it is a secondary consideration in our investment management process that first and foremost is focused on generating compensation for a given level of targeted risk.
Disclosures and Definitions
Index Benchmarks presented within this report may not reflect factors relevant for your portfolio or your unique risks, goals or investment objectives. Past performance of an index is not an indication or guarantee of future results. It is not possible to invest directly in an index.
- The Standard & Poor’s 500 (S&P 500) is a market-cap weighted index comprised of the common stocks of 500 leading companies in leading industries of the U.S. economy.
- Bloomberg U.S. Aggregate Index covers the U.S. investment grade fixed rate bond market, with index components for government and corporate securities, mortgage pass-through securities, and asset-backed securities.
Investment advisory services offered through Thrivent Advisor Network, LLC., a registered investment adviser and a subsidiary of Thrivent. Advisory Persons of Thrivent provide advisory services under a “doing business as” name or may have their own legal business entities. However, advisory services are engaged exclusively through Thrivent Advisor Network, LLC, a registered investment adviser. Cedar Cove Wealth Partners and Thrivent Advisor Network, LLC are not affiliated companies. Information in this message is for the intended recipient[s] only. Please visit our website www.cedarcovewealth.com for important disclosures.
The material presented includes information and opinions provided by a party not related to Thrivent Advisor Network. It has been obtained from sources deemed reliable; but no independent verification has been made, nor is its accuracy or completeness guaranteed. The opinions expressed may not necessarily represent those of Thrivent Advisor Network or its affiliates. They are provided solely for information purposes and are not to be construed as solicitations or offers to buy or sell any products, securities, or services. They also do not include all fees or expenses that may be incurred by investing in specific products. Past performance is no guarantee of future results. Investments will fluctuate and when redeemed may be worth more or less than when originally invested. You cannot invest directly in an index. The opinions expressed are subject to change as subsequent conditions vary. Thrivent Advisor Network and its affiliates accept no liability for loss or damage of any kind arising from the use of this information.
Different types of investments involve varying degrees of risk. Therefore, it should not be assumed that future performance of any specific investment or investment strategy will be profitable.
The price-to-earnings ratio (P/E ratio) is the ratio for valuing a company that measures its current share price relative to its earnings per share (EPS). The price-to-earnings ratio is also sometimes known as the price multiple or the earnings multiple.
