
Gambit
2025 Quarter 1 Market Commentary
Summary
- U.S. markets faced a challenging first quarter. U.S. large-cap stocks ended the quarter down 4%, while U.S. small-cap stocks declined by nearly 10%.
- The government is pursuing aggressive trade and fiscal policies, using tariffs and reducing wasteful spending to restructure federal debt—partly to support extending tax cuts.
- March saw a sharp drop in both investor and consumer sentiment, with tariff-related concerns cited as the key reason for growing uncertainty.
- The Trump administration is making a high-stakes economic gambit—wagering that short-term pain from tariffs and tighter fiscal policies will yield long-term gains in deficit reduction, domestic manufacturing, and rebalanced global trade.
Overview
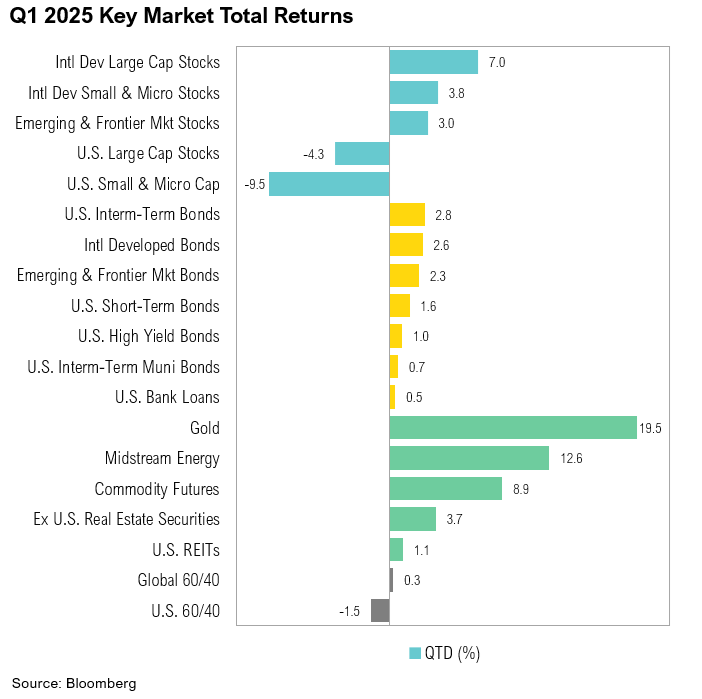
U.S. equity markets faced a challenging first quarter. U.S. large-cap stocks, as represented by the S&P 500, ended the first three months of 2025 down 4.3%, while the small-cap Russell 2000 Index declined 9.5%. This marked the worst quarter for both U.S. large- and small-cap stocks since the second quarter of 2022. In contrast, U.S. fixed income markets fared better, with the Bloomberg U.S. Aggregate Bond Index gaining 2.8% in the first three months of the new year.
Final fourth-quarter gross domestic product (GDP) results, released at the end of March, confirmed that the U.S. economy continued its steady pace of growth throughout 2024. GDP growth for the quarter was revised marginally upward, from 2.3% to an annualized 2.4%.1 Government spending increased at an annualized rate of 3.1% while consumer spending grew by 4.0%—the strongest pace of 2024.
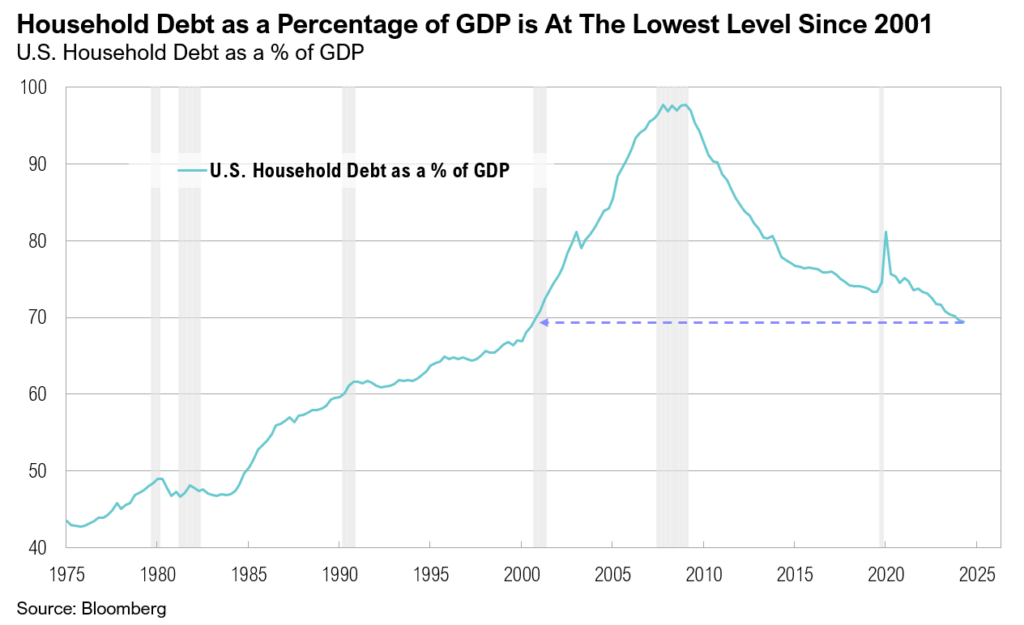
Personal income has grown steadily in 2025, rising 0.9% month-over-month in January, followed by another strong increase of 0.8% in February. Although personal savings remain below pre-pandemic levels, they have started to recover, reaching 4.6% in February as income growth outpaced spending.2 Meanwhile, U.S. household debt-to-GDP levels have declined to 70%, the lowest since 2001.
Inflation remains sticky, but there are promising signs. Headline inflation rose to 3.0% year-over-year in January before easing to 2.8% in February, aided by declines in food and energy prices. Notably, core inflation in February rose at the slowest pace since April 2021, increasing by 3.1% year-over-year.3 As expected, the Federal Reserve kept interest rates unchanged at its March Federal Open Market Committee (FOMC) meeting. Despite inflation above 2%, Fed officials still anticipate the equivalent of two 0.25% rate reductions for 2025, while market expectations for rate cuts increased from two 0.25% cuts to three, with the first cut expected in June.4 The Fed also announced plans to slow the pace of quantitative tightening, reducing its monthly runoff from $60 billion to $40 billion, with a maximum Treasury runoff of $5 billion per month starting in April.5 Fed Chair Jerome Powell attributed this decision to the debt ceiling, which was reached in January.
The 2024 earnings season concluded in March, and S&P 500 earnings grew by a solid 11% for the year. Growth was led by the communication services (+23%), technology (+19%), and financial (+19%) sectors.6 Looking ahead, earnings growth estimates for the first quarter have declined from 12% at the start of the year to 7% by the end of March. At the sector level, healthcare (+36%), technology (+15%), and utilities (+10%) are expected to drive earnings growth in the first quarter.6
Gambit
In chess, a gambit is a strategy where a player deliberately sacrifices a piece in the opening to gain a positional or tactical advantage. The goal is usually to achieve faster development, gain better control of the board, or put the opponent in a difficult situation. As the economy adjusts to reduced government spending and the impact of tariffs, President Donald Trump and Treasury Secretary Scott Bessent are willing to accept short-term economic pain to pursue potential long-term gains.
The Mar-a-Lago Accord is a conceptual economic strategy proposed by the Trump administration that aims to restructure the global financial system to reduce U.S. debt and address economic imbalances.7 Key elements of the proposal include boosting American manufacturing and restructuring U.S. debt by leveraging tariffs and geopolitical influence, including pressuring trade partners to absorb financial burdens and adjust currency values.8 Though not an official policy, the Mar-a-Lago Accord envisions reshaping global trade and finance by tying economic measures to national security (while sparking debate over its feasibility and risks).
The Trump administration’s high-stakes economic gambit seeks to reduce government spending and increase revenue to extend the expiring Tax Cuts and Jobs Act beyond its scheduled expiration at the end of 2025. The administration has also proposed eliminating income taxes on Social Security benefits, overtime, and tips, which would reduce government revenue by over $1.5 trillion over the next ten years.9,10
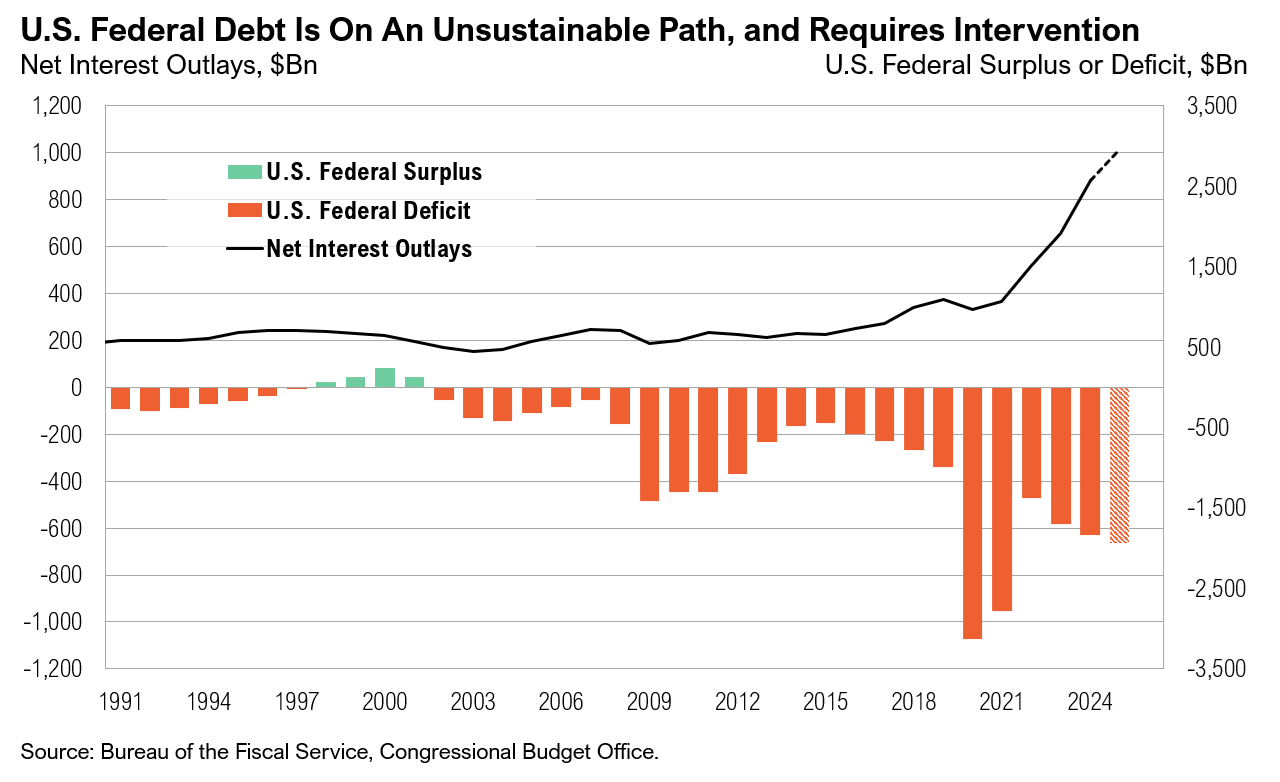
The government has emphasized that reducing the fiscal deficit is a top priority. The Department of Government Efficiency (DOGE), created to improve accountability and efficiency through strategic reforms, reports saving approximately $140 billion so far.11 While this represents a small portion of the $1.2 trillion fiscal deficit accumulated this fiscal year, the initiative, led by Elon Musk, appears to have widespread support, at least for now.12,13,14 Treasury Secretary Scott Bessent has expressed strong alignment with Musk’s efforts, stating, “I am completely aligned with what Elon’s doing.” Public sentiment also reflects approval, with a recent Harvard CAPS-Harris poll showing that 77% of Americans believe a comprehensive review of government spending is necessary.13 Additionally, 83% of respondents—including 72% of Democrats and 94% of Republicans—support cutting wasteful expenditures.13 DOGE has set an ambitious goal of reducing wasteful government spending by $1 trillion by May 2025. While the initiative has its challenges, it reflects a bipartisan desire to address inefficiencies and promote fiscal responsibility.16
One of the Trump administration’s opening moves has been implementing aggressive targeted tariffs on various countries and global trade sectors, citing national security and economic interests. On April 2, baseline tariffs of 10% were announced on all imports to the U.S., and higher rates were implemented for major trading partners.17,18 U.S. trade partners with the highest reciprocal tariffs include China (54%), the European Union (20%), Vietnam (46%), South Africa (30%), India (26%) and Japan (24%).17,18 Unlike China, Canada and Mexico avoided additional tariffs. The Trump administration also confirmed a 25% tariff on all foreign-made automobiles.
In 2018, during his first term, President Trump tweeted:
“The European Union is coming to Washington tomorrow to negotiate a deal on trade… Both the U.S. and EU [should] drop all tariffs, barriers, and subsidies. That would finally be called [a] free market and fair trade…”19
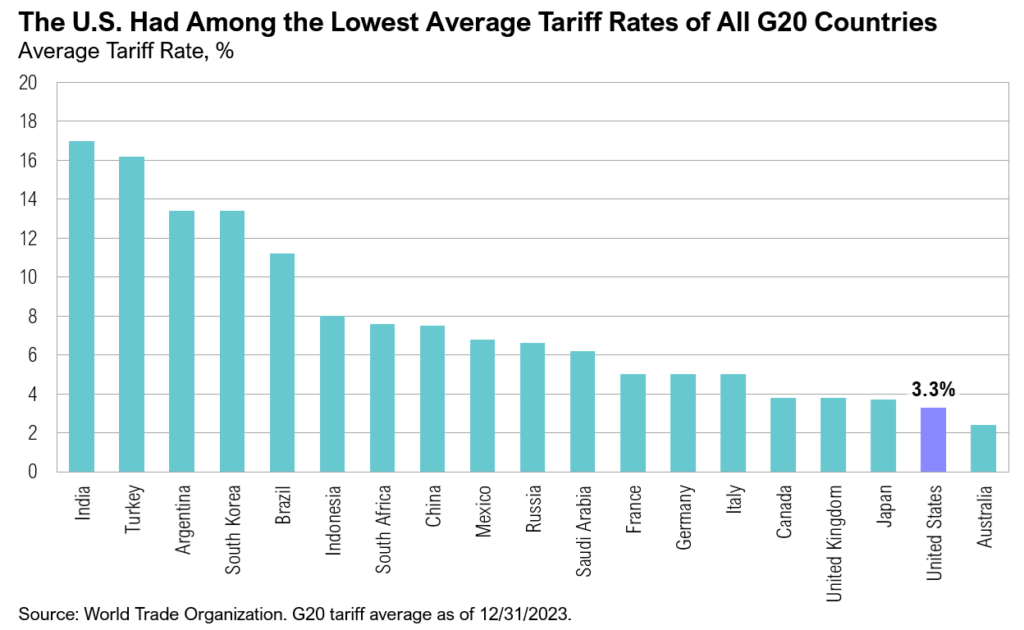
The Trump administration appears to be leveraging tariffs for two primary purposes: as a negotiating tool and as unconventional macroeconomic strategy. When used as a macroeconomic tool, these tariffs are designed to protect domestic U.S. industries and encourage reshoring. Unlike most countries, the U.S. has historically maintained relatively low trade barriers, with an average tariff rate of roughly 3%. A third reason for aggressive tariffs on Canada and Mexico was to curb drug trafficking and stop the flow of drugs crossing into the U.S. via neighboring borders. Recent data from the U.S. Customs and Border Protection shows drug seizures in February dropping to the lowest level in at least three years.20
Several countries have already proposed tariff cuts on U.S. imports in efforts to avoid reciprocal tariffs. For example, India has offered to cut tariffs on over half of U.S. imports, including farm products such as almonds, worth $23 billion.21 Similarly, the European Union is engaged in talks to identify potential concessions in exchange for the partial removal of U.S. tariffs.22 To avoid or mitigate tariffs, global corporations have pledged nearly $1 trillion in U.S. investment since Trump’s inauguration.23 Apple, for example, has committed $500 billion over the next four years, while Taiwan Semiconductor plans to invest $100 billion to advance semiconductor manufacturing in the U.S., and South Korea’s Hyundai investing $21 billion over the next three years to improve the U.S. supply chain and build a new steel plant in Louisiana.23,24
But all gambits come at an immediate cost. Investor sentiment declined sharply in March. The American Association of Individual Investors (AAII) sentiment survey showed bearish sentiment rising to a one-year high of 61% in the last week of February, and sentiment remained negative throughout March. An average of 58% of survey respondents expressed a bearish outlook for U.S. equities over the next six months.25 Similarly, the Bank of America’s Global Fund Manager Survey in March recorded the largest pullback in investor sentiment in five years. In just three months, the percentage of fund managers overweight in U.S. equities fell from a record high to one of the lowest levels in over twenty years.26 While the National Federation of Independent Businesses (NFIB) Small Business Optimism Index remained above average in February, the Small Business Uncertainty Index rose to its second-highest level on record since 1975.27
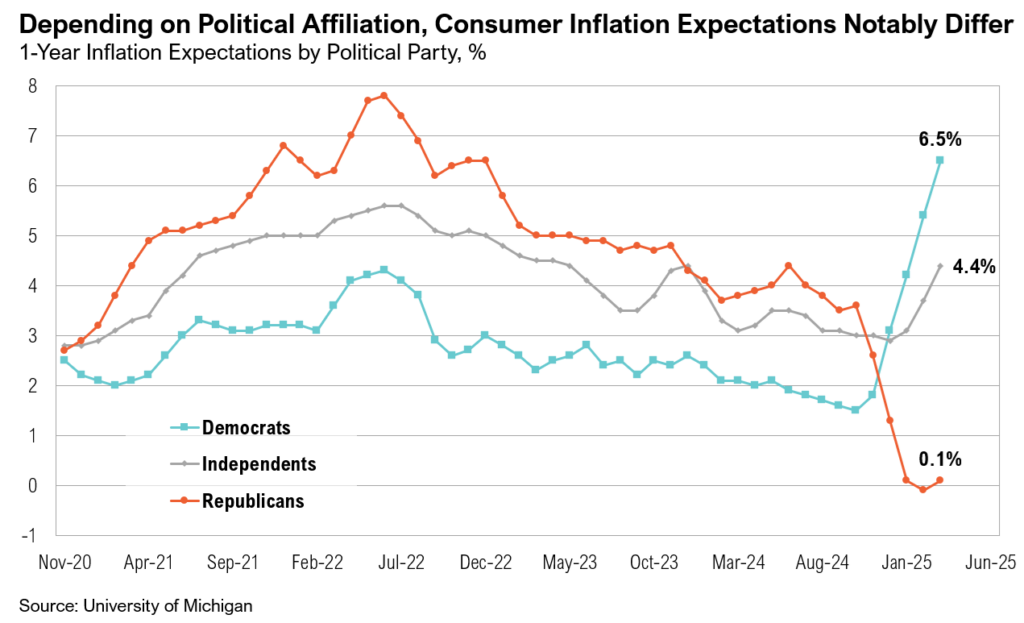
Consumer confidence followed a similar downward trajectory. The Conference Board’s Consumer Confidence Index in March fell to its lowest level since the pandemic, and the University of Michigan’s survey recorded its lowest sentiment reading since November 2022.28,29 The University of Michigan survey also found that expectations for personal finances hit the lowest level since 1978, and an unprecedented 51% of respondents made unsolicited negative comments about government economic policy.29,30 Depending on political affiliation, consumer inflation expectations notably diverged over the quarter. Those identifying as Democrats expect inflation to more than double, rising to 6.5% over the next year, while Republican-leaning survey respondents believe that inflation is going to all but disappear over the next twelve months. Across both investor and consumer surveys, tariffs were cited as the primary driver of growing uncertainty.
The Federal Reserve’s latest economic projections, released at the March Federal Open Market Committee meeting and lacking the specific tariff details provided on April 2, anticipated a minimal lasting impact on inflation. However, in a speech on April 4, Fed Chairman Jerome Powell stated, “We face a highly uncertain outlook with elevated risks of both higher unemployment and higher inflation… While tariffs are highly likely to generate at least a temporary rise in inflation, it is also possible that the effects could be more persistent.” While Powell’s comments do not reflect an official updated forecast from the FOMC, they speak to the difficulty the Fed faces balancing rising inflation expectations and slowing economic growth.
Markets
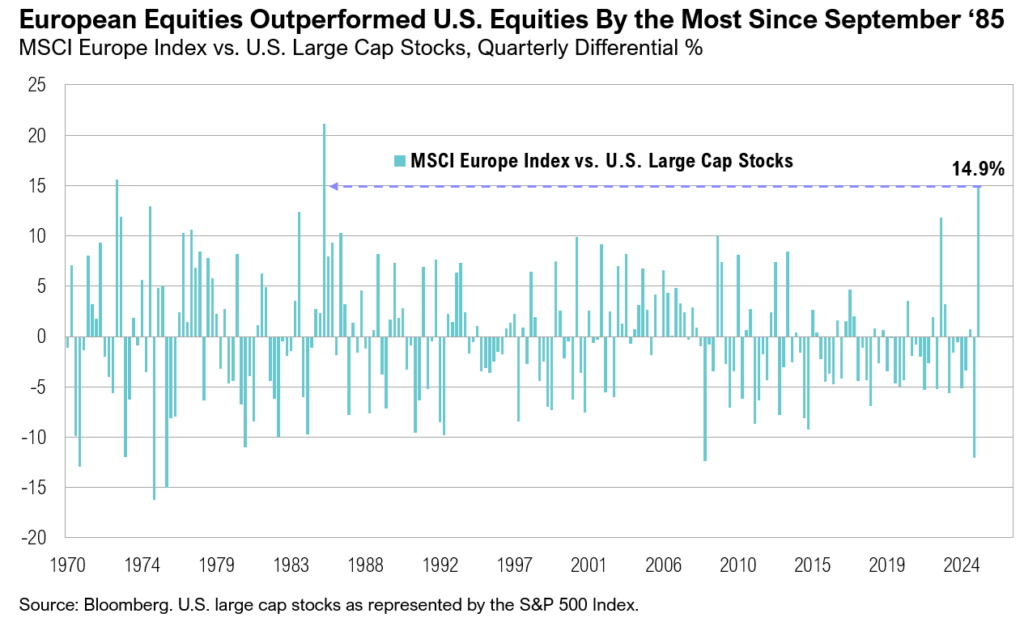
U.S. equity markets reached a stalemate in March. Large-cap stocks fell over 4% for the month, capping off their worst quarter since early 2022 and underperforming global equities by the widest margin since 2009. In fact, European equities had their strongest quarter relative to the S&P 500 since September 1985, outperforming U.S. large-cap stocks by 15% when the Plaza Accord was signed with the goal of weakening the dollar to reduce the U.S. trade deficit.32 U.S. small-cap stocks ended the quarter down nearly 10%, their worst quarterly performance since the second quarter of 2022 when the Russell 2000 declined by 18%.
The Magnificent Seven—Apple, Microsoft, Amazon, Alphabet, Nvidia, Meta, and Tesla—have been a driving force behind the S&P 500’s rally in recent years, fueled by strong fundamentals, market leadership, and exposure to transformative trends like artificial intelligence. However, together, the group ended the first quarter down 16%, driven by Tesla (-36%), Nvidia (-19%), and Alphabet (-18%). Tesla was the second-worst performing company in the S&P 500, surpassed only by Deckers Outdoor, which ended the quarter down 45%. The downturn in stock prices led to a pullback in valuations, bringing the Magnificent Seven’s valuation premium relative to the rest of the S&P 500 to its lowest level since 2017.33
International equity markets outperformed U.S. equities in the first quarter of 2025. Large-cap stocks in developed international markets outpaced their U.S. counterparts by more than 10%, with the MSCI EAFE Index gaining 7%. In Europe, investor optimism—fueled by an $860 billion defense spending package—helped push the MSCI Europe up 11% during the quarter. Of note, German stocks, proxied by the MSCI Germany Index, rallied 16%. Similarly, international developed-market small-cap stocks rose 4% over the quarter, whereas U.S. small-cap stocks fell 10%, making them the worst-performing major asset class year-to-date.
Among emerging markets, Brazil (+14.1%) and China (+15.0%) led the gains. Meanwhile, after reaching a two-year high on January 13, the U.S. dollar weakened, ending the quarter down 4%. This sharp reversal in performance brought relative valuations between U.S. and non-U.S. stocks back in line with their five-year average, although they remain above longer-term averages.34
Fixed-income markets had a strong start to the year, with U.S. intermediate-term bonds gaining 3% over the quarter. After rising to 4.8% in mid-January (the highest level since October 2023), the 10-year U.S. Treasury yield ended March below 4.2% due to rising uncertainty surrounding tariffs. The yield curve (the spread between the 10-year and 2-year Treasury yields) remained positive throughout the quarter, finishing March at 0.3%.
Gold gained 20% over the quarter, closing March at a new all-time high above $3,100. West Texas Intermediate (WTI) crude oil prices declined by $7 per barrel over the quarter to end at $71 per barrel, despite news of slowing U.S. oil production, which in January fell to the lowest level in a year.
Looking Forward
President Trump and Treasury Secretary Bessent appear to be playing the long game, hoping that consumers and markets—particularly bond markets—will look beyond a short-term period of uncertainty, or “detox” in the words of Bessent, in exchange for the long-term benefits stemming from a reduced fiscal deficit, increased domestic manufacturing and reshoring, economic growth, and more balanced global trade practices. In many ways, their approach resembles a gambit in chess—deliberately sacrificing short-term stability in pursuit of long-term gains. The key question remains whether this is a calculated risk that will ultimately pay off or if the so-called chess game will end in checkmate for U.S. economic growth.
Citations
- BEA: https://www.bea.gov/data/gdp/gross-domestic-product
- Federal Reserve of St. Louis: https://fred.stlouisfed.org/series/PSAVERT
- Federal Reserve of St. Louis: https://fred.stlouisfed.org/series/CPILFESL
- CME FedWatch: https://www.cmegroup.com/markets/interest-rates/cme-fedwatch-tool.html
- Federal Reserve: https://www.federalreserve.gov/mediacenter/files/FOMCpresconf20250319.pdf
- FactSet: https://advantage.factset.com/hubfs/Website/Resources%20Section/Research%20Desk/Earnings%20Insight/EarningsInsight_032825.pdf
- Bloomberg: https://www.bloomberg.com/news/articles/2025-02-20/-mar-a-lago-accord-chatter-is-getting-wall-street-s-attention
- Financial Times: https://www.ft.com/content/fba87dd3-514a-41c2-b2b9-ea597ffbdfbf
- Penn Wharton Budget Model: https://budgetmodel.wharton.upenn.edu/issues/2025/2/10/eliminating-income-taxes-on-social-security-benefits
- Forbes: https://www.forbes.com/sites/shaharziv/2025/03/05/trump-speech-to-congress-renews-call-for-no-tax-on-tips/
- Department of Government Efficiency: https://www.doge.gov/savings
- AP-NORC: https://apnorc.org/projects/although-support-for-doge-is-mixed-a-majority-believe-corruption-inefficiency-and-red-tape-are-major-problems/
- Harvard-Harris Poll: https://harvardharrispoll.com/wp-content/uploads/2025/02/HHP_Feb2025_vFinal.pdf
- AP News: https://apnews.com/article/ap-norc-poll-trump-musk-doge-approval-23d49b2dcdadd0d6f625c6b4451b2c8d
- All-In Podcast: https://www.youtube.com/watch?v=lSma9suyp24
- Bloomberg: https://www.bloomberg.com/news/articles/2025-03-27/musk-says-doge-aims-to-finish-1-trillion-in-cuts-by-end-of-may
- BBC: https://www.bbc.com/news/articles/c1jxrnl9xe2o
- Wall Street Journal: https://www.wsj.com/livecoverage/trump-tariffs-trade-war-stock-market-04-02-2025
- Jeff Weniger via X: https://x.com/JeffWeniger/status/1899544455981498719/photo/2
- S. Customs and Border Protection: https://www.cbp.gov/newsroom/stats/drug-seizure-statistics
- Reuters: https://www.reuters.com/world/india/india-offers-us-tariff-cuts-farm-imports-eyes-trade-success-government-sources-2025-03-28/
- Bloomberg: https://www.bloomberg.com/news/newsletters/2025-03-28/eu-identifies-concessions-for-trump-in-trade-war
- Bloomberg: https://www.bloomberg.com/news/articles/2025-02-25/apple-openai-among-tech-firms-pledging-over-1-trillion-since-trump-took-office
- CNBC: https://www.cnbc.com/2025/03/24/south-korea-hyundai-us-investment.html
- AAII: https://www.aaii.com/sentimentsurvey/sent_results
- Financial Times: https://www.ft.com/content/d43b2929-74b4-4121-9c58-1eba5be321bc
- NFIB: https://www.nfib.com/wp-content/uploads/2025/03/NFIB-SBET-Report-Feb.-2025.pdf
- Wall Street Journal: https://www.wsj.com/livecoverage/stock-market-today-dow-nasdaq-sp500-03-25-2025/card/consumer-confidence-drops-further-key-measure-flags-recession-risk-JCuJNmUtCUAJgblTrwUm
- Bloomberg: https://www.bloomberg.com/news/articles/2025-03-14/us-consumer-sentiment-drops-price-expectations-soar-on-tariffs
- Michael McDonough via X: https://x.com/M_McDonough/status/1905628662528950301/photo/1
- Federal Reserve: https://www.federalreserve.gov/monetarypolicy/files/fomcprojtabl20250319.pdf
- Investopedia: https://www.investopedia.com/terms/p/plaza-accord.asp
- CNBC: https://www.cnbc.com/2025/03/14/techs-3-week-selloff-wipes-out-2point7-trillion-in-value-from-megacaps.html
- Bloomberg, SpringTide calculations based on forward price-to-earnings for Russell 1000 vs. MSCI ACWI Ex-U.S.
Asset Class Definitions
Asset class performance was measured using the following benchmarks: U.S. Large Cap Stocks: S&P 500 TR Index; U.S. Small & Micro Cap: Russell 2000 TR Index; Intl Dev Large Cap Stocks: MSCI EAFE GR Index; Emerging & Frontier Market Stocks: MSCI Emerging Markets GR Index; U.S. Interm-Term Muni Bonds: Bloomberg 1-10 (1-12 Yr) Muni Bond TR Index; U.S. Interm-Term Bonds: Bloomberg U.S. Aggregate Bond TR Index; U.S. High Yield Bonds: Bloomberg U.S. Corporate High Yield TR Index; U.S. Bank Loans: Morningstar LSTA US LL TR Index; Intl Developed Bonds: Bloomberg Global Aggregate ex-U.S. Index; Emerging & Frontier Market Bonds: Bloomberg EM USD Aggregate TR Index; U.S. REITs: MSCI U.S. REIT GR Index, Ex U.S. Real Estate Securities: S&P Global Ex-U.S. Property TR Index; Commodity Futures: Bloomberg Commodity TR Index; Midstream Energy: Alerian MLP TR Index; Gold: LBMA Gold Price, U.S. 60/40: 60% S&P 500 TR Index; 40% Bloomberg U.S. Aggregate Bond TR Index; Global 60/40: 60% MSCI ACWI GR Index; 40% Bloomberg Global Aggregate Bond TR Index.
Performance Disclosures
All market pricing and performance data from Bloomberg, unless otherwise cited. Asset class and sector performance are gross of fees unless otherwise indicated.
Disclosures & Definitions
Advisory Person(s) may use proprietary financial planning tools, calculators and third-party tools and materials (“Third-Party Materials”) to develop your financial planning recommendations. The projections or other information generated by Third-Party Materials regarding the likelihood of various investment outcomes are hypothetical in nature, do not reflect actual investment results, and are not guarantees of future results. Results may vary with each use and over time. Thrivent Advisor Network, LLC and its advisors do not provide legal, accounting or tax advice. Consult your attorney and or tax professional regarding these situations.
The return assumptions in Third-Party Materials are not reflective of any specific product, and do not include any fees or expenses that may be incurred by investing in specific products. The actual returns of a specific product may be more or less than the returns used. It is not possible to directly invest in an index. Financial forecasts, rates of return, risk, inflation, and other assumptions may be used as the basis for illustrations. They should not be considered a guarantee of future performance or a guarantee of achieving overall financial objectives. Past performance is not a guarantee or a predictor of future results of either the indices or any particular investment. Investing involves risks, including the possible loss of principal.
Advisory Persons of Thrivent Advisor Network provide advisory services under a “doing business as” name or may have their own legal business entities. However, advisory services are engaged exclusively through Thrivent Advisor Network, LLC, a registered investment adviser. Cedar Cove Wealth Partners and Thrivent Advisor Network, LLC are not affiliated companies.
Securities offered through Thrivent Investment Management Inc. (“TIMI”), member FINRA and SIPC, and a subsidiary of Thrivent, the marketing name for Thrivent Financial for Lutherans. Thrivent.com/disclosures. TIMI and Cedar Cove Wealth Partners are not affiliated companies.
The material presented includes information and opinions provided by a party not related to Thrivent Advisor Network. It has been obtained from sources deemed reliable; but no independent verification has been made, nor is its accuracy or completeness guaranteed. The opinions expressed may not necessarily represent those of Thrivent Advisor Network or its affiliates. They are provided solely for information purposes and are not to be construed as solicitations or offers to buy or sell any products or services. They also do not include all fees or expenses that may be incurred by investing in specific products. Performance is no guarantee of future results. Investments will fluctuate and when redeemed may be worth more or less than when originally invested and cannot invest directly in an index. Opinions expressed are subject to change as subsequent conditions vary. Thrivent Advisor Network and its affiliates accept no liability for loss or damage of any kind arising from the use of this information.
This communication may include forward looking statements. Specific forward-looking statements can be identified by the fact that they do not relate strictly to historical or current facts and include, without limitation, words such as “may,” “will,” “expects,” “believes,” “anticipates,” “plans,” “estimates,” “projects,” “targets,” “forecasts,” “seeks,” “could’” or the negative of such terms or other variations on such terms or comparable terminology. These statements are not guarantees of future performance and involve risks, uncertainties, assumptions and other factors that are difficult to predict and that could cause actual results to differ materially.
Any specific securities identified and described do not represent all of the securities purchased, sold, or recommended for advisory clients. The reader should not assume that investments in the securities identified and discussed were or will be profitable. A summary description of the principal risks of investing in a particular model is available upon request. There can be no assurance that a model will achieve its investment objectives. Investment strategies employed by the advisor in selecting investments for the model portfolio may not result in an increase in the value of your investment or in overall performance equal to other investments. The model portfolio’s investment objectives may be changed at any time without prior notice. Portfolio allocations are based on a model portfolio, which may not be suitable for all investors. Clients should also consider the transactions costs and/or tax consequences that might result from rebalancing a model portfolio. Frequent rebalancing may incur additional costs and/or tax consequences versus less rebalancing. Please notify us if there have been any changes to your financial situation or your investment objectives, or if you would like to place or modify any reasonable restrictions on the management of your account.
Index Benchmarks presented within this report may not reflect factors relevant for your portfolio or your unique risks, goals or investment objectives. Past performance of an index is not an indication or guarantee of future results. It is not possible to invest directly in an index.
The Alerian MLP Index is the leading gauge of energy infrastructure Master Limited Partnerships (MLPs). The capped, float-adjusted, capitalization-weighted index, whose constituents earn the majority of their cash flow from midstream activities involving energy commodities, is disseminated real-time on a price-return basis (AMZ) and on a total-return basis (AMZX).
The Bloomberg Commodity® Index (BCOM) is a broadly diversified commodity price index distributed by Bloomberg Index Services Limited.
The Bloomberg EM (Emerging Markets) USD Aggregate Index® is a flagship hard currency Emerging Markets debt benchmark that includes fixed and floating-rate U.S. dollar-denominated debt issued from sovereign, quasi-sovereign, and corporate EM issuers.
The Bloomberg Global Aggregate® Index is a flagship measure of global investment grade debt from twenty-four local currency markets. This multi-currency benchmark includes treasury, government-related, corporate and securitized fixed-rate bonds from both developed and emerging markets issuers.
The Bloomberg Global Aggregate ex USD Index is a measure of investment grade debt from 24 local currency markets. This multi-currency benchmark includes treasury, government-related, corporate and securitized fixed-rate bonds from both developed and emerging markets issuers. Bonds issued in USD are excluded.
The Bloomberg U.S. Aggregate Bond® Index, or the Agg, is a broad base, market capitalization-weighted bond market index representing intermediate term investment grade bonds traded in the United States. Investors frequently use the index as a stand-in for measuring the performance of the U.S. bond market.
The Bloomberg U.S. Corporate High Yield Bond® Index measures the USD-denominated, high yield, fixed-rate corporate bond market. Securities are classified as high yield if the middle rating of Moody’s, Fitch and S&P is Ba1/BB+/BB+ or below.
The Consumer Price Index (CPI) is a measure of the average change over time in the prices paid by urban consumers for a market basket of consumer goods and services.
The LBMA (London Bullion Market Association ) Gold Price Index measures the performance of setting price of gold, determined twice each business day on the London bullion market by the five members of The London Gold Market Fixing Ltd.
The Magnificent 7 stocks are a group of mega-cap stocks that drive the market’s performance due to their heavy weighting in major stock indexes such as the Standard & Poor’s 500 and the Nasdaq 100. The group’s seven stocks earned their name in 2023 due to their strong performance and ability to power indexes higher seemingly without help from smaller stocks. The Magnificent 7 includes the following: Apple (AAPL), Microsoft (MSFT), Alphabet (GOOG and GOOGL), Amazon (AMZN), NVIDIA (NVDA), Tesla (TSLA), and Meta Platforms (META).
The Michigan Consumer Sentiment Index (MCSI) is a monthly survey of consumer confidence levels in the United States conducted by the University of Michigan.
The MSCI ACWI (Morgan Stanley Capital International All Country World Index) is a stock index designed to track broad global equity-market performance. Maintained by Morgan Stanley Capital International (MSCI), the index captures large and mid cap representation across 23 Developed Markets (DM) and 24 Emerging Markets (EM) countries.
The MSCI EAFE® (Morgan Stanley Capital International Europe, Australasia, and the Far East) Index is a broad market index of stocks located within countries in Europe, Australasia, and the Middle East.
The MSCI (Morgan Stanley Capital International) Emerging Markets® Index is a selection of stocks that is designed to track the financial performance of key companies in fast-growing nations.
The MSCI (Morgan Stanley Capital International) US REIT Index is a free float-adjusted market capitalization weighted index that is comprised of equity Real Estate Investment Trusts (REITs). The index is based on the MSCI USA Investable Market Index (IMI), its parent index, which captures the large, mid and small cap segments of the USA market.
The Morningstar LSTA (Loan Syndications and Trading Association) US Leveraged Loan Index is designed to deliver comprehensive, precise coverage of the US leveraged loan market.
The National Federation of Independent Business (NFIB) is a small business association representing small and independent businesses. A nonprofit, nonpartisan organization founded in 1943, NFIB represents the consensus views of its members in Washington and all 50 state capitals.
The Russell 2000® Index measures the performance of the 2,000 smaller companies that are included in the Russell 3000® Index, which itself is made up of nearly all U.S. stocks. The Russell 2000® is widely regarded as a bellwether of the U.S. economy because of its focus on smaller companies that focus on the U.S. market.
The Standard & Poor’s 500 (S&P 500) is a market-cap weighted index comprised of the common stocks of 500 leading companies in leading industries of the U.S. economy. You cannot invest directly in an index.
The S&P Global ex-U.S. Property Index is a free-float-adjusted, market-capitalization-weighted index that measures the equity market performance of international real estate stocks in both developed and emerging markets.
The American Association of Individual Investors (AAII) Sentiment Survey is a weekly poll (indicator) of its members’ opinion on where the market will be in six months, is often written about by financial bloggers and other personal investment organizations, who consider the survey to be among the best of contrarian indicators.
The Bureau of Labor Statistics (BLS) is an agency of the United States Department of Labor. It is the principal fact-finding agency in the broad field of labor economics and statistics and serves as part of the U.S. Federal Statistical System. BLS collects, calculates, analyzes, and publishes data essential to the public, employers, researchers, and government organizations.
Capitalization (Cap) is used to describe the size of the company, by market capitalization as follows:
- mega-cap: market value of $200 billion or more;
- large-cap: market value between $10 billion and $200 billion;
- mid-cap: market value between $2 billion and $10 billion;
- small-cap: market value between $250 million and $2 billion; and
- micro-cap: market value of less than $250 million
CNBC is an American business news television channel, formerly called Consumer News and Business Channel until 1991.
COVID (COrona VIrus Disease) is the new name of this disease is coronavirus disease 2019, abbreviated as COVID-19. In COVID-19, ‘CO’ stands for ‘corona,’ ‘VI’ for ‘virus,’ and ‘D’ for the disease. Formerly, this disease was referred to as “2019 novel coronavirus” or “2019-nCoV.”
The Conference Board Consumer Confidence Survey (CCS) is a monthly report that measures consumer attitudes and buying intentions, providing insights into the overall health of the U.S. economy from a consumer perspective.
The Federal Open Market Committee (FOMC) is the branch of the Federal Reserve System that determines the direction of monetary policy. The FOMC has 12 voting members, including all seven members of the Board of Governors and a rotating group of five Reserve Bank presidents. The Chair of the Board of Governors also serves as Chair of the FOMC.
FRED (Federal Reserve Economic Data) is an online database consisting of hundreds of thousands of economic data time series from scores of national, international, public, and private sources.
Gross domestic product (GDP) is the total monetary or market value of all the finished goods and services produced within a country’s borders in a specific time period. As a broad measure of overall domestic production, it functions as a comprehensive scorecard of a given country’s economic health.
GDPNow is a model from the Federal Reserve Bank of Atlanta that forecasts the growth of gross domestic product (GDP). It is based on a methodology similar to the one used by the U.S. Bureau of Economic Analysis (BEA). It complements the BEA’s quarterly GDP release.
The Harvard CAPS (Center for American Political Studies) / Harris Poll is conducted by The Harris Poll & HarrisX online within the United States every month and captures the responses of over 2,000 registered voters. The results reflect a nationally representative sample.
A real estate investment trust (REIT) is a company that owns, operates, or finances income-generating real estate.
