
Key Observations
- Thus far the much-anticipated recession has failed to materialize. Our view remains that while the risk of a recession is rising, it is better to position portfolios to weather potential economic risks rather than fall prey to the pitfalls often found with market timing.
- The narrow market rally in mega-cap technology stocks propelled equities through the 2nd quarter as widespread belief in generative AI technologies drove revenue expectations, despite mounting expectations for the economy to slow over the coming quarters.
- China’s slower than expected economic rebound failed to materialize during the quarter, weighing on developed and emerging market stocks.
- Job and wage growth remained strong throughout the quarter, prompting the FOMC to continue raising interest rates despite volatility in the banking sector.
Market Recap
Markets turned in another strong quarter to start the year, as the continued rally from mega-cap technology stocks was enough to bring the S&P 500 to an 8.7% gain. Fueled by a wave of investor confidence in the power of generative AI technology, earnings expectations continued to rise for the handful of stocks keeping the market afloat. While US equities entering a new bull market made countless headlines during the quarter, gains were anything but widespread with the top seven companies contributing 74% of gains for the quarter (1). Across styles, Growth continued to add to its year-to-date lead over Value, with the Russell 1000 Growth Index rising 12.8%, compared to the 4.1% gain for the Russell 1000 Value Index. Large cap stocks also outperformed small cap stocks, with the S&P 500 rising 8.7% compared to 5.2% for the Russell 2000 (2).
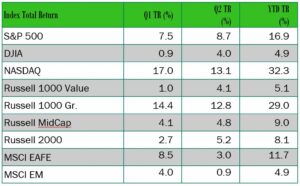
Overseas, the excitement over China’s potential economic rebound waned as growth failed to materialize during the quarter, weighing on developed and emerging market stocks. Developed markets rose 3.0%, while emerging markets only returned 0.9% as China finished the quarter making up just under 30% of the index (3). As a result of Chinese equities tumbling 9.7%, strong returns from India (+12.3%) and Brazil (+20.7%) were not enough to drive index returns into strongly positive territory (4). Also weighing on international returns was persistently high inflation in Europe, driving the Bank of England and the European Central Bank to hike rates 50 bps in June, further pressuring economic growth, and leaving yields higher but bond prices lower (5).
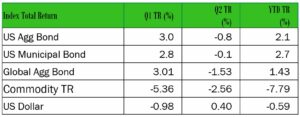
What caused fixed income markets to finish the quarter in negative territory after a strong Q1 and given inflation is slowly improving? Volatility in the banking sector, and the US narrowly avoiding the debt ceiling deadline contributed to uncertainty in the path of interest rates, as well as continued strong numbers coming from the labor market giving the Fed breathing room to continue to hike rates into restrictive territory. As a result, the 10-year Treasury yield rose to 3.84%, while the 2-year Treasury yield rose to 4.90% sending the yield curve inversion to -106 bps, only 2 bps less than the maximum reached in March, just days before Silicon Valley Bank, and Signature Bank failed.
Inflation also markedly moderated throughout the quarter in line with our expectations for a meaningful decline in inflation without fully “solving” inflation and meeting the Fed’s target of 2%. Though the middle of the year that has certainly been the case. June Headline CPI reached 3%, down from 9.1% in June of 2022 (6). If shelter CPI data catches up to real-time data, it is likely to continue to dampen the inflation outlook. Furthermore, nearer-term data continues to decelerate, giving the Fed more flexibility in future policy. One sign for continued optimism on the inflation front is that “super core” CPI (CPI less shelter, food, and energy) has risen just 2.8% on an annual basis (7). These near-term inflation trends indicate even more progress than is reflected in the annual headline figures (7).
Concluding Thoughts
While markets and the broader economy have weathered several left-tail risks this quarter including the banking crisis and the debt ceiling negotiations, in terms of recessionary risks, we believe that the current rally in equities required broader participation in order for gains from the first half of the year to be sustainable. However, this is not our base case as historically continued outperformance is not when norm when just a few companies lead the market up. It is our view that many factors indicate that growth is slowing, as we wait for the lag time to allow the Fed’s rate hikes to take full effect. However, we remain cognizant that current earnings estimates do not fully indicate a recession and given the strong relationship between stock prices and expected earnings recommend remaining somewhat defensive, similar to the beginning of this year where a recession seemed imminent, but up to this point has always remained “6 months away”.
In the current environment it is important to remember that markets are forward-looking, and investors may already be looking past a mild economic contraction later this year. Recessions are a normal part of the economic cycle, and rather than fearing them, we believe in the construction of resilient portfolios that embrace their inevitability. Also, the news cycle seems to have conditioned investors to view recessions as catastrophic events, akin to the global financial crisis or the COVID-19 pandemic. In reality, not all recessions are created equal, and the slowdown we are anticipating this year is orders of magnitude smaller than the aforementioned cases. While 2023 has offered new opportunities and challenges, we believe our long-term outlook and portfolio positioning remains the same as when we came into the year. We will continue to monitor recessionary risks, and growing market trends, including AI and semiconductor technologies, and adjust portfolios where there is opportunity. For more information, please contact any of the professionals at Cedar Cove Wealth Partners.
Footnotes
- Technology and tech-adjacent stocks include Apple, Microsoft, Amazon, Nvidia, Alphabet (A & C shares), Tesla, and Meta Platforms. These stocks are the largest constituents in the Technology, Consumer Discretionary, and Communication Services sectors as of June 30, 2023. These three sectors led performance in Q1 2023, rising 21.8%, 16.1%, and 20.5% on a total return basis, respectively. The same sectors continued to dominate performance in the Q2 rising 17.2%, 14.6%, and 13.1%. In Q1 and Q2 the S&P 500 TR Index rose 7.5% and 8.75%, with a YTD return of 16.89%. All data obtained through Morningstar Direct.
- Morningstar Direct as of June 30, 2023. MSCI EAFE and MSCI EM shown on a net return basis.
- Developed market equities proxied using the MSCI EAFE NR USD Index; Emerging Markets proxied using the MSCI EM NR USD Index.
- MSCI EM Index country weights provided by MSCI as of 6/30/2023. China, India and Brazil stock performance proxied using the following USD indices: MSCI China NR, MSCI India Domestic NR, and MSCI Brazil NR.
- The indexes referenced are the Bloomberg US Aggregate Total Return, Bloomberg Municipal Total Return, Bloomberg Global Aggregate TR USD indexes, and the US dollar measure relative to a basket of foreign currencies using its weighted geometric mean of EUR (57.6%), JPY (13.6%), GBP (11.9%), CAD (9.1%), SEK (4.2%), CHF (3.6%). Q4 returns are for the period from 7/1/2022-9/30/2022; year-to-date (YTD) returns are from 1/1/2022 – 9/30/2022 and trailing twelve months (TTM) returns are from 10/1/2021-9/30/2022.
- S. Bureau of Labor Statistics as of June 2023.
- S. Bureau of Labor Statistics as of May 31, 2023.
Comparisons to any indices referenced herein are for illustrative purposes only and are not meant to imply that actual returns or volatility will be similar to the indices. Indices cannot be invested in directly. Unmanaged index returns assume reinvestment of any and all distributions and do not reflect our fees or expenses.
- The Bloomberg Commodity® Index is calculated on an excess return basis and reflects commodity futures price movements. The index rebalances annually weighted 2/3 by trading volume and 1/3 by world production and weight-caps are applied at the commodity, sector and group level for diversification.
- The Bloomberg Global Aggregate® Index is a flagship measure of global investment grade debt from twenty-four local currency markets. This multi-currency benchmark includes treasury, government-related, corporate and securitized fixed-rate bonds from both developed and emerging markets issuers.
- The Bloomberg U.S. Aggregate® Index covers the U.S. investment grade fixed rate bond market, with index components for government and corporate securities, mortgage pass-through securities, and asset-backed securities.
- The Bloomberg U.S. Municipal® Index covers the USD-denominated long-term tax-exempt bond market. The index has four main sectors: state and local general obligation bonds, revenue bonds, insured bonds and pre-refunded bonds.
- The Consumer Price Index (CPI) is a measure of the average change over time in the prices paid by urban consumers for a market basket of consumer goods and services.
- The Dow Jones Industrial Average (DJIA), also known as the Dow 30, is a stock market index that tracks 30 large, publicly owned blue-chip companies trading on the New York Stock Exchange (NYSE) and the NASDAQ.
- The Federal Funds Rate is the target interest rate range set by the FOMC. This is the rate at which commercial banks borrow and lend their excess reserves to each other overnight. The FOMC sets a target federal funds rate eight times a year, based on prevailing economic conditions.
- The Federal Open Market Committee (FOMC) is the branch of the Federal Reserve System that determines the direction of monetary policy.
- The MSCI EAFE® Index is an equity index which captures large and mid-cap representation across Developed Markets countries around the world, excluding the U.S. and Canada. The index covers approximately 85% of the free float-adjusted market capitalization in each country.
- The MSCI Emerging Markets® Index captures large and mid-cap representation across Emerging Markets countries. The index covers approximately 85% of the free-float adjusted market capitalization in each country.
- The NASDAQ (National Association of Securities Dealers Automated Quotations) Composite Index is the market capitalization-weighted index of over 2,500 common equities listed on the NASDAQ stock exchange.
- The Russell 1000 Growth® Index measures the performance of the Russell 1000® ‘s growth segment, which is defined to include firms whose share prices have higher price-to-book ratios and higher expected earnings growth rates.
- The Russell 1000 Value® Index measures the performance of the large-cap value segment of the U.S. equity universe. It includes those Russell 1000® companies with lower price-to-book ratios and lower expected and historical growth rates.
- The Russell 2000® Index measures the performance of the 2,000 smaller companies that are included in the Russell 3000® Index, which itself is made up of nearly all U.S. stocks. The Russell 2000® is widely regarded as a bellwether of the U.S. economy because of its focus on smaller companies that focus on the U.S. market.
- The Russell Midcap® Index is a market capitalization-weighted index comprised of 800 publicly traded U.S. companies with market caps of between $2 and $10 billion. The 800 companies in the Russell Midcap® Index are the 800 smallest of the 1,000 companies that comprise Russell 1000® Index.
- The S&P 500® is a capitalization-weighted index designed to measure performance of the broad domestic economy through changes in the aggregate market value of 500 stocks representing all major industries.
- The U.S. Dollar Index – known as USDX, DXY, DX and USD Index – is a measure of the value of the United States Dollar (USD) against a weighted basket of currencies used by U.S. trade partners. The index will rise if the Dollar strengthens against these currencies and fall if it weakens.
Material Risks
- Fixed Income securities are subject to interest rate risks, the risk of default and liquidity risk. U.S. investors exposed to non-U.S. fixed income may also be subject to currency risk and fluctuations.
- Cash may be subject to the loss of principal and over longer periods of time may lose purchasing power due to inflation.
- Domestic Equity can be volatile. The rise or fall in prices take place for a number of reasons including, but not limited to changes to underlying company conditions, sector or industry factors, or other macro events. These may happen quickly and unpredictably.
- International Equity can be volatile. The rise or fall in prices take place for a number of reasons including, but not limited to changes to underlying company conditions, sector or industry impacts, or other macro events. These may happen quickly and unpredictably. International equity allocations may also be impacted by currency and/or country specific risks which may result in lower liquidity in some markets.
This material is provided for informational purposes only and is not solely intended to be relied upon as a forecast, research or investment advice, and is not a recommendation, offer or solicitation to buy or sell any securities or to adopt any investment strategy. The views and strategies described may not be suitable for all investors. They also do not include all fees or expenses that may be incurred by investing in specific products. Past performance is no guarantee of future results. Investments will fluctuate and when redeemed may be worth more or less than when originally invested. You cannot invest directly in an index. The opinions expressed are subject to change as subsequent conditions vary. Advisory services offered through Thrivent Advisor Network, LLC.
This communication may include forward looking statements. Specific forward-looking statements can be identified by the fact that they do not relate strictly to historical or current facts and include, without limitation, words such as “may,” “will,” “expects,” “believes,” “anticipates,” “plans,” “estimates,” “projects,” “targets,” “forecasts,” “seeks,” “could’” or the negative of such terms or other variations on such terms or comparable terminology. These statements are not guarantees of future performance and involve risks, uncertainties, assumptions and other factors that are difficult to predict and that could cause actual results to differ materially.
The material presented includes information and opinions provided by a party not related to Thrivent Advisor Network. It has been obtained from sources deemed reliable; but no independent verification has been made, nor is its accuracy or completeness guaranteed. The opinions expressed may not necessarily represent those of Thrivent Advisor Network or its affiliates. They are provided solely for information purposes and are not to be construed as solicitations or offers to buy or sell any products, securities, or services. They also do not include all fees or expenses that may be incurred by investing in specific products. Past performance is no guarantee of future results. Investments will fluctuate and when redeemed may be worth more or less than when originally invested. You cannot invest directly in an index. The opinions expressed are subject to change as subsequent conditions vary. Thrivent Advisor Network and its affiliates accept no liability for loss or damage of any kind arising from the use of this information.
Investment advisory services offered through Thrivent Advisor Network, LLC., (herein referred to as “Thrivent”), a registered investment adviser. Clients will separately engage an unaffiliated broker-dealer or custodian to safeguard their investment advisory assets. Review the Thrivent Advisor Network Financial Planning and Consulting Services, Investment Management Services (Non-Wrap) and Wrap-Fee Program brochures (Form ADV Part 2A and 2A Appendix 1 brochures) for a full description of services, fees and expenses, available at Thriventadvisornetwork.com. Thrivent Advisor Network, LLC financial advisors may also be registered representatives of a broker-dealer to offer securities products.
Certain Thrivent Advisor Network LLC advisors may also be registered representatives of a broker-dealer to offer securities products. Advisory Persons of Thrivent provide advisory services under a “doing business as” name or may have their own legal business entities. However, advisory services are engaged exclusively through Thrivent Advisor Network, LLC, a registered investment adviser. Please visit our website www.thriventadvisornetwork.com for important disclosures.
The opinions expressed are subject to change as subsequent conditions vary. Reliance upon information in this material is at the sole discretion of the reader. International investing involves additional risks, including risks related to foreign currency, limited liquidity, government regulation and the possibility of substantial volatility due to adverse political, economic or other developments. The two main risks related to fixed income investing are interest rate risk and credit risk. Typically, when interest rates rise, there is a corresponding decline in the market value of bonds. Credit risk refers to the possibility that the issuer of the bond will not be able to make principal and interest payments. Index performance is shown for illustrative purposes only.
Advisory Persons of Thrivent provide advisory services under a “doing business as” name or may have their own legal business entities. However, advisory services are engaged exclusively through Thrivent Advisor Network, LLC, a registered investment adviser. Cedar Cove Wealth Partners and Thrivent Advisor Network, LLC are not affiliated companies. Information in this message is for the intended recipient[s] only. Please visit our website www.cedarcovewealth.com for important disclosures.
Securities offered through Purshe Kaplan Sterling Investments (“PKS”), Member FINRA/SIPC. PKS is headquartered at 80 State Street, Albany, NY 12207. PKS and Cedar Cove Wealth Partners are not affiliated companies.
