
1Q Summary and market Considerations
Market Commentary
- The failure of two regional banks in the United States and the forced merger of Credit Suisse late in the quarter ignited concern about global financial contagion, but idiosyncratic risks tied to depositors, asset liability mismatches, and management failures do not appear characteristic of the broader financial system. However, US banking regulations are likely to increase and credit conditions are set to tighten as banks maintain greater liquidity to manage deposit flight risks, shifts that will likely put pressure on bank earnings.
- The Federal Reserve hiked the fed funds rate by 25 bps in February and March, bringing the target range to 4.75%–5.00%. Importantly, the regional bank failures in March are expected to act as an additional one to two rate hikes as noted by Chairman Powell during his March press conference. As such, the terminal fed funds rate is likely to be lower than previously estimated, allowing investors to shift their focus away from the Fed as they focus on the impact of policy decisions already made.
- The first quarter of the year saw prices recover across most broad asset classes, excluding commodities, as bond yields generally fell, and earnings expectations declined for stocks. Countervailing fundamental forces, such as nonfarm payrolls expanding by more than one million new jobs and broad measures of inflation rolling over, helped offset weakness in the housing market, fed policy uncertainty, and tighter financial conditions, that on net investors viewed positively.
Equity
- Last year’s technology laggards stole the limelight as the sector returned almost 22% for the quarter, helping boost the tech-heavy NASDAQ 17.1% while the broader S&P 500 rose 7.5%.[i] The recovery in prices came despite dwindling Q1 earnings expectations that fell 6.3% over the last three months, leaving the 12-month forward P/E ratio at 17.8x, above the 25-year average of 16.8x. [ii]
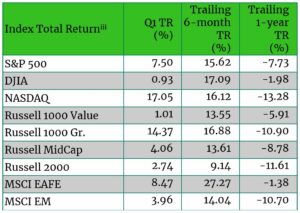
- The breadth of equity performance was considerable with “long duration” large-cap growth stocks handily outperforming value. For the quarter, the Russell 1000 Growth Index rose 14.4%, 13.3% ahead of Value, which eked out a 1.0% gain. A similar performance gap emerged between large and small cap stocks, with the S&P 500 finishing 4.8% ahead of the Russell 2000, which despite dropping 6.4% in February and March, finished the quarter up 2.7%. Similarly, at the sector level technology and communication services rose about 21%, outperforming the two worst performing sectors, financials and energy, by more than 25%.
- International developed markets added to their recent outperformance over US equities, with the MSCI EAFE rising 8.5%, nearly 1% more than the S&P 500. Over the last six months MSCI EAFE performance has exceeded the S&P 500 by almost 12%. The slowing pace of rate hikes by the Fed and better than expected economic growth helped investors look past the continued uncertainties tied to Ukraine, energy supplies, and diplomatic uncertainties. Emerging markets were up nearly 4%, buoyed by the gradual resumption of economic activity in China and dollar weakness.
Fixed Income
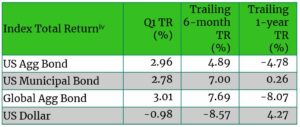
- Examining yields at the beginning and end of the quarter, credit markets appeared well behaved with the Bloomberg US and Global Aggregate Bond indices rising about 3.0% each, reflecting price gains in the wake of yields that fell across maturities one year and longer. The two-year and ten-year Treasury yields finished down 35 and 40 basis points, respectively, ending the quarter at 4.06% and 3.48%, a narrowing of the persistent yield curve inversion. However, between these two points, particularly in March, yields moved swiftly and at levels rarely experienced in fixed income markets, including six consecutive days of the two-year yield rising or falling by 25 bps or more.
- Volatility accelerated in early March following a series of strong employment reports and an improving ISM PMI composite index, which provided ample evidence supporting the hawkish testimony Chairman Powell delivered to Congress. But, just days later a mini-banking crisis triggered by the collapse of Silicon Valley Bank (SVB) and Signature Bank, sent yields on a rollercoaster ride that over the subsequent weeks saw the two-year yield move 1.29% from peak to trough while the ten-year yield moved 0.71%.
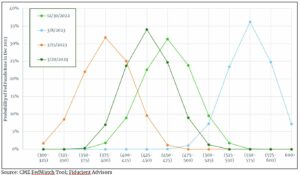
- The volatility in yields was unsettling for investors as 30-day fed fund futures struggled to coalesce around any one rate outlook that would be determined by forthcoming FOMC policy decisions. At the start of the year the majority of investors expected the fed funds rate to end 2023 around 4.63%. After Powell’s testimony to Congress, year-end expectations rose a full point to 5.63%, but one week later the collapse of SVB, Signature Bank, and the forced merger between UBS and Credit Suisse, expectations were nearly two points lower at 3.88%. By the end of the quarter, investor anxiety had tapered off as the decisive actions taken by the Federal Reserve, FDIC, and Swiss National Bank left depositors and investors feeling reassured that a full-blown banking crisis had been avoided; rate expectations ended about where they began, at 4.38%.
Real Assets
- Commodity markets were the lone broad asset class to lose value in the first quarter[i], with energy prices significantly falling thanks to a warm winter across much of Europe that eased consumer demand. Precious metals appreciated as investors sought safety during the mini-banking crisis, which helped offset energy losses.
- Equity REITs ended the quarter higher, though persistently high levels of office vacancies that remain near 50% according to Kastle data[ii], and a wall of related loan maturities over the next two years estimated near $1 trillion dollars, created a wide dispersion of returns among REIT sectors with office REITs down almost 16% and the self-storge sector up more than 13%[iii].
Market Considerations
Expectations regarding the outlook for the US economy have remained largely unchanged since the start of the year. In fact, the most recent Bloomberg survey of Economists placed the odds of a US recession in 2023 at 65%[iv], down 5% since the December survey despite enduring a mini-banking crisis, the Federal Reserve hiking rates twice, and a decline in earnings expectations for the quarter and calendar year. So how does one reconcile mounting evidence of a recession and the continued optimism reflected in equity valuations and bond spreads? The answer: not easily.
Historically, US earnings decline by 20%-40% in an average recession. According to the latest bottom-up earnings analysis by FactSet[v], 2023 calendar year S&P 500 earnings per share are expected to rise by $1.02 to $220.21. Although year-over-year anticipated earnings growth remains positive, annualized earnings have fallen by about 3% since peaking in the second quarter of last year and the Q1 2023 estimate at $50.34 is 11% lower than quarterly peak earnings. While earnings expectations have fallen, the rate of decline is far less than historical levels would suggest prudent for even a mild recession and with equity prices higher to start the year, stocks appear expensive. However, strong and improving corporate free cashflows, a healthy labor market, and high starting margins are fundamentally supportive of stock prices.
One key challenge for investors is positioning portfolios for the trilemma facing the Fed and the resulting policy decisions it must make. The Fed is seeking to maintain financial stability while reducing inflation using higher interest rates that will ultimately tighten financial conditions to the point of limiting credit access, thereby reducing economic activity and in turn financial stability. While a “soft landing” remains possible, the path to doing so continues to narrow and should it disappear altogether, the Fed’s unambiguous fight against inflation makes it unlikely that it will rescue the economy with rate cuts should it falter before inflation has been tamed.
While we do not know with certainty that inflation will continue to fall, the recent trends in a variety of measures including the consumer price index (CPI), producer price index (PPI), and personal consumption expenditures price index (PCE) have all rolled over, suggesting that peak inflation is behind us and providing Fed officials with some confidence that the effects of the current rate hiking cycle are beginning to work their way through the economy. While broad measures of inflation are slowing or even falling, elevated employment costs are proving sticky. A key challenge to reducing employment costs, which are highly correlated with rising prices, are demographics and policy roadblocks. In terms of demographics, the US population is growing at approximately 0.5% per year, down from the two percent growth rate when the first baby boomer was born and the one percent growth present throughout most of the 80s and 90s. As a result, the US population is aging which will limit work force participation in the decades ahead. In fact, the US Census Bureau projects that by 2030, one fifth (20%) of the population will be 65 years or older, up from 12.5% in 1990. When coupled with an estimated 1.3 – 4.3 million workers that died or left the workforce as a result of the pandemic[vi], and immigration policies that eliminated an estimated 3 million workers[vii], the supply of available workers is likely insufficient to satisfy the demands for labor outside of a major recession. Consequently, monetary policy could experience intermittent pauses between shorter hiking cycles before inflation is finally brought under control or plateau for much longer than investors are currently expecting.
Despite ample reasons that justify caution, there are a number of indicators that may prove sufficient and aid in delivering a soft landing. First, US households are structurally sound. The household debt service ratio is 9.8% versus 13.2% in the fourth quarter of 2007 entering the GFC[viii], 80% of mortgages are locked with fixed rates below 4%[ix], and savings levels remain elevated thanks to pandemic related fiscal stimulus and spending constraints. Second, free cashflows at US corporations are positive and improving, reducing the need for loans, and profitability remains supported by historically high starting margins. These conditions have helped keep credit spreads tight despite significant yield volatility and should help reduce defaults in the event of a recession. Finally, elevated but slowing inflation coupled with a tight labor market remains supportive of real wage growth. While this may slow the rate of decline in core inflation, it would be supportive of consumption, which makes up almost 70% of US GDP.
Concluding Thoughts
The rapid appreciation in stocks and bonds to start the year seems overly optimistic, requiring stocks to maintain earnings in order to justify current valuations, while the decline in bond yields assumes inflation may quickly fall back in line to the Fed’s 2% target. While both of these are possibilities, we remain skeptical they can be achieved simultaneously. Nonetheless, the US economy is slowing from a position of strength, which should help moderate any economic weakness relative to other prior business cycle lows. While it is difficult to position portfolios for tail risks, we would be remiss in our responsibilities to ignore the possibility of escalations in the War in Ukraine, the upcoming debate on the debt ceiling, rising diplomatic tensions between the US and China, and the wall of commercial real estate loans maturing in the next two years. While each of these carries separate considerations, we do not anticipate any of these events will come to fruition and significantly impair capital, though developments pertaining to each of these, as well as other known unknowns, are likely to foster volatility.
While we do not have the benefit of precision in our decision making, we can prepare and anticipate that 2023 will prove to be a better year to add risk than 2022 notwithstanding the challenges we have outlined. Given these circumstances, our stock positioning continues to favor dividend income, profitability, and quality, while our bond exposures favor higher credit quality, liquidity, and modest duration exposures.
Thanks for taking a look!
________________________
[i] Morningstar Direct, Bloomberg Commodity Total Return index declined 5.36% during the first quarter.
[ii] https://www.kastle.com/safety-wellness/getting-america-back-to-work/
[iii] Morningstar Direct, REIT performance cited is based on the FTSE Nareit All REIT TR with REIT sector performance based on the FTSE Nareit Equity Office TR FTSE Nareit Equity Self Storage TR
[iv] https://www.bloomberg.com/news/articles/2023-03-28/economists-boost-us-recession-odds-on-higher-rates-banking-woes
[v] FactSet Earnings Insights, John Butters, “S&P 500 will likely report a decline in earnings..” April 17, 2023
[vi] McKinsey and Company, Charlie Berdan, et al, “One billion days lost: How COVID-19 is hurting the us work force”, January 2023
[vii][vii] Robert W. Baird & Co., Bond Market Review, April 19, 2023
[viii] Bureau of Economic Analysis, March 31, 2023 and JP Morgan Asset Management GTM
[ix] https://www.bloomberg.com/news/articles/2023-03-03/most-us-mortgages-are-pandemic-vintage-locked-beyond-fed-reach
Disclosures:
Investment advisory services offered through Thrivent Advisor Network, LLC., a registered investment adviser and a subsidiary of Thrivent. Advisory Persons of Thrivent provide advisory services under a “doing business as” name or may have their own legal business entities. However, advisory services are engaged exclusively through Thrivent Advisor Network, LLC, a registered investment adviser. Cedar Cove Wealth Partners and Thrivent Advisor Network, LLC are not affiliated companies. Information in this message is for the intended recipient[s] only. Please visit our website www.cedarcovewealth.com for important disclosures.
The material presented includes information and opinions provided by a party not related to Thrivent Advisor Network. It has been obtained from sources deemed reliable; but no independent verification has been made, nor is its accuracy or completeness guaranteed. The opinions expressed may not necessarily represent those of Thrivent Advisor Network or its affiliates. They are provided solely for information purposes and are not to be construed as solicitations or offers to buy or sell any products, securities, or services. They also do not include all fees or expenses that may be incurred by investing in specific products. Past performance is no guarantee of future results. Investments will fluctuate and when redeemed may be worth more or less than when originally invested. You cannot invest directly in an index. The opinions expressed are subject to change as subsequent conditions vary. Thrivent Advisor Network and its affiliates accept no liability for loss or damage of any kind arising from the use of this information.
Any specific securities identified and described do not represent all of the securities purchased, sold, or recommended for advisory clients. The reader should not assume that investments in the securities identified and discussed were or will be profitable. A summary description of the principal risks of investing in a particular model is available upon request. There can be no assurance that a model will achieve its investment objectives. Investment strategies employed by the advisor in selecting investments for the model portfolio may not result in an increase in the value of your investment or in overall performance equal to other investments. The model portfolio’s investment objectives may be changed at any time without prior notice. Portfolio allocations are based on a model portfolio, which may not be suitable for all investors. Clients should also consider the transactions costs and/or tax consequences that might result from rebalancing a model portfolio. Frequent rebalancing may incur additional costs and/or tax consequences versus less rebalancing. Please notify us if there have been any changes to your financial situation or your investment objectives, or if you would like to place or modify any reasonable restrictions on the management of your account.
The two main risks related to fixed income investing are interest rate risk and credit risk. Typically, when interest rates rise, there is a corresponding decline in the market value of bonds. Credit risk refers to the possibility that the issuer of the bond will not be able to make principal and interest payments.
This communication may include forward looking statements. Specific forward-looking statements can be identified by the fact that they do not relate strictly to historical or current facts and include, without limitation, words such as “may,” “will,” “expects,” “believes,” “anticipates,” “plans,” “estimates,” “projects,” “targets,” “forecasts,” “seeks,” “could’” or the negative of such terms or other variations on such terms or comparable terminology. These statements are not guarantees of future performance and involve risks, uncertainties, assumptions and other factors that are difficult to predict and that could cause actual results to differ materially.
Index Benchmarks presented within this report may not reflect factors relevant for your portfolio or your unique risks, goals or investment objectives. Past performance of an index is not an indication or guarantee of future results. It is not possible to invest directly in an index.
The Bloomberg Global Aggregate® Index is a flagship measure of global investment grade debt from twenty-four local currency markets. This multi-currency benchmark includes treasury, government-related, corporate and securitized fixed-rate bonds from both developed and emerging markets issuers.
The Bloomberg U.S. Aggregate Bond® Index, or the Agg, is a broad base, market capitalization-weighted bond market index representing intermediate term investment grade bonds traded in the United States. Investors frequently use the index as a stand-in for measuring the performance of the U.S. bond market.
The Bloomberg U.S. Municipal® Index covers the USD-denominated long-term tax-exempt bond market. The index has four main sectors: state and local general obligation bonds, revenue bonds, insured bonds and pre-refunded bonds.
The Consumer Price Index (CPI) is a measure of the average change over time in the prices paid by urban consumers for a market basket of consumer goods and services.
The Dow Jones Industrial Average (DJIA), also known as the Dow 30, is a stock market index that tracks 30 large, publicly owned blue-chip companies trading on the New York Stock Exchange (NYSE) and the NASDAQ.
The MSCI EAFE® (Morgan Stanley Capital International Europe, Australasia, and the Far East) Index is a broad market index of stocks located within countries in Europe, Australasia, and the Middle East.
The MSCI (Morgan Stanley Capital International) Emerging Markets® Index is a selection of stocks that is designed to track the financial performance of key companies in fast-growing nations.
The NASDAQ (National Association of Securities Dealers Automated Quotations) Composite Index is the market capitalization-weighted index of over 2,500 common equities listed on the NASDAQ stock exchange.
The PCE (Personal Consumption Expenditures) Price Index – A measure of the prices that people living in the United States, or those buying on their behalf, pay for goods and services. The PCE price index is known for capturing inflation (or deflation) across a wide range of consumer expenses and reflecting changes in consumer behavior.
The Producer Price Index (PPI) is a family of indexes that measures the average change over time in selling prices received by domestic producers of goods and services. PPIs measure price change from the perspective of the seller. This contrasts with other measures, such as the Consumer Price Index (CPI), that measure price change from the purchaser’s perspective. Sellers’ and purchasers’ prices may differ due to government subsidies, sales and excise taxes, and distribution costs.
The Russell 1000 Growth® Index measures the performance of the Russell 1000® ‘s growth segment, which is defined to include firms whose share prices have higher price-to-book ratios and higher expected earnings growth rates.
The Russell 1000 Value® Index measures the performance of the large-cap value segment of the U.S. equity universe. It includes those Russell 1000® companies with lower price-to-book ratios and lower expected and historical growth rates.
The Russell 2000® Index measures the performance of the 2,000 smaller companies that are included in the Russell 3000® Index, which itself is made up of nearly all U.S. stocks. The Russell 2000® is widely regarded as a bellwether of the U.S. economy because of its focus on smaller companies that focus on the U.S. market.
The Russell Midcap® Index is a market capitalization-weighted index comprised of 800 publicly traded U.S. companies with market caps of between $2 and $10 billion. The 800 companies in the Russell Midcap® Index are the 800 smallest of the 1,000 companies that comprise Russell 1000® Index.
The S&P 500® Index, or the Standard & Poor’s 500® Index, is a market-capitalization-weighted index of the 500 largest U.S. publicly traded companies.
The U.S. Dollar Index – known as USDX, DXY, DX and USD Index – is a measure of the value of the United States Dollar (USD) against a weighted basket of currencies used by U.S. trade partners. The index will rise if the Dollar strengthens against these currencies and fall if it weakens.
The CME FedWatch Tool, is a tool created by the CME Group (Chicago Mercantile Exchange Group) to act as a barometer for the market’s expectation of potential changes to the fed funds target rate while assessing potential Fed movements around Federal Open Market Committee (FOMC) meetings.
The Federal Deposit Insurance Corporation (FDIC) is an independent agency created by Congress to maintain stability and public confidence in the nation’s financial system. To accomplish this mission, the FDIC insures deposits; examines and supervises financial institutions for safety, soundness, and consumer protection; makes large and complex financial institutions resolvable; and manages receiverships.
The Federal Open Market Committee (FOMC) is the branch of the Federal Reserve System that determines the direction of monetary policy.
Gross domestic product (GDP) is the total monetary or market value of all the finished goods and services produced within a country’s borders in a specific time period. As a broad measure of overall domestic production, it functions as a comprehensive scorecard of a given country’s economic health.
The GFC (global financial crisis) refers to the period of extreme stress in global financial markets and banking systems between mid-2007 and early 2009.
The Household Debt Service Ratio (DSR) is the ratio of total required household debt payments to total disposable income. The DSR is divided into two parts. The Mortgage DSR (MDSP) is total quarterly required mortgage payments divided by total quarterly disposable personal income.
Personal consumption expenditures (PCEs) refer to a measure of imputed household expenditures defined for a period of time.
The price-to-earnings ratio (P/E ratio) is the ratio for valuing a company that measures its current share price relative to its earnings per share (EPS). The price-to-earnings ratio is also sometimes known as the price multiple or the earnings multiple.
A real estate investment trust (REIT) is a company that owns, operates, or finances income-generating real estate.
