
A Pivot to Pause?
Signs of peaking inflation and the potential for central bank moderation in 2023 pushed equity markets higher in November.
Key Observations
- Risk assets rallied on the back of softening inflation data and “Fed pause” mentality
- The Federal Reserve reiterated its commitment to combat inflation, but a pivoting tone hinted at the potential for a slowing pace of hikes in 2023
- Emerging market equities, led by China, were a standout for the month
- The U.S. yield curve remains inverted at levels not seen since the early ‘80s, historically signaling a recession, but the timing of the start and magnitude vary widely
Market Recap
Stocks extended the October rally into November, continuing to claw back returns from lows earlier in the year. Investor sentiment swung 180 degrees as economic data showed signs of peaking inflation and the resulting potential for a slowing pace of Federal Reserve (“Fed”) rate hikes heading into 2023. Fears of a recession that spooked markets earlier in the year have either moderated or been accepted by investors and, despite economic activity starting to trend down, markets remained resilient. U.S. equity markets generally saw mid-single digit returns, driven by larger cap companies, while small cap stocks, as measured by the Russell 2000 Index, posted a modest positive return.
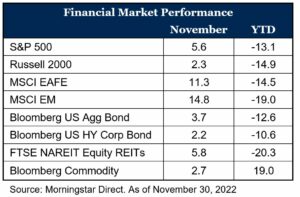
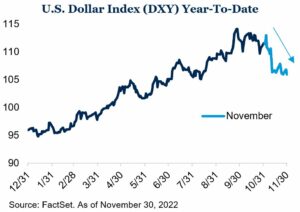
Non-U.S. equities rose in the month and widely outpaced their domestic counterparts. A new prime minister in the U.K. and clarity on reforms, as well as favorable inflation prints in Germany and Spain, likely helped push international developed markets (MSCI EAFE Index) higher. The U.S. dollar weakened compared to many major currencies, providing an additional tailwind for international stocks. Emerging market equities (MSCI EM Index) also saw double digit gains in the month.
China also remained in the headlines where positive sentiment about the potential for easing restrictions on the zero-COVID policy overshadowed protests later in the month. MSCI China returned 29.7 percent in November (1).
Fixed income markets also generated positive returns for the month on the back of lower interest rates. The U.S. 10-year yield fell 42 basis points, ending the month below four percent on the heels of better-than-expected inflation data (2). However, front-end rates moved higher after the Fed raised its target rate an additional 75 basis points at the November meeting. Securities down the capital stack, e.g., U.S. corporate high yield, also fared well in the risk-on environment. Inflation sensitive areas of the market such as REITs and commodities eked out modestly positive returns in November, but both segments saw mixed performance from underlying sectors. Within the commodities market, falling energy prices were more than offset by strength in industrial and precious metals.
Shifting Sentiment
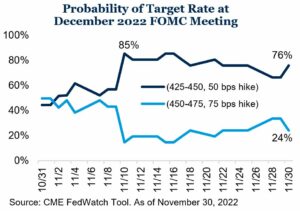
The October inflation report marked a turning point in investor sentiment. U.S. CPI grew 7.7 percent year-over-year in October (3). While still elevated, the print came in below expectations and marks the lowest reading since January. Investors pivoted to the “Fed pause” narrative, sending the S&P 500 Index up 5.6 percent on November 10th, the best day of 2022 thus far, and among the top trading days on record (4). Expectations for a moderating Federal Reserve soared, with the market shifting to an 85 percent probability of a 50 basis points rate hike in December rather than a 75 basis point hike (5). Markets are also pricing in a pause in the rate hike campaign in 2023. The Fed remains committed to being in a “higher for longer” mindset, but the statement coming out of the November 2 meeting lends some credence to the possibility of a pause in 2023 as the committee accounts for the “lags with which monetary policy affects economic activity and inflation.” (6).
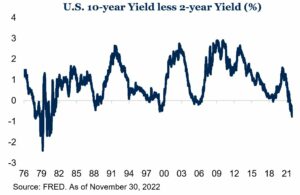
Inflation expectations have moved lower as investors digested the recent CPI report and Fed messaging. This pushed rates on the long end of the U.S. yield curve lower and, based on the difference between the 10-year and 2-year Treasury yields, the curve is now the most inverted it has been since the 1980s (touching -77 basis points during the month) (7). An inverted yield curve has historically been a warning sign of recession to come, and the Fed has made it clear they are willing to sacrifice growth to bring down inflation. We are starting to see signs of slowing activity – PMI numbers moderating, housing data softening, etc. – but the U.S. labor market remains resilient, consumer balance sheets are generally in favorable positions and the BEA reported Q3 2022 GDP growth of 2.9 percent in its second estimate (8). It remains to be seen if the Fed can navigate a “soft landing” in the new year.
Outlook
The Federal Reserve and its commitment to fight inflation remains at the forefront of the investment discussion. Recent inflation data is showing signs the worst may be behind us and the possibility of a central bank pause in 2023 has breathed recent life into financial markets. However, risks lurk on the horizon and the chance of recession in the next year is elevated – financial conditions have moved tighter since the beginning of the year, inflation, while slowing, remains very high and geopolitical risks persist around the world. Despite these risks, we remain steadfast in our view that taking a strategic and disciplined approach to investing allows for the highest probability of achieving long-term investment objectives.
As always, should you have additional questions, please reach out to any of the professionals at Cedar Cove Wealth Partners.
Footnotes
- MSCI, November 30, 2022
- FRED Data, November 30, 2022
- S. Bureau of Labor Statistics, November 10, 2022
- Morningstar Direct, November 10, 2022
- CME FedWatch Tool, November 30, 2022
- FOMC Statement, November 2, 2022
- FRED Data, November 30, 2022
- BEA, November 30, 2022
Disclosures and Definitions
Comparisons to any indices referenced herein are for illustrative purposes only and are not meant to imply that actual returns or volatility will be similar to the indices. Indices cannot be invested in directly. Unmanaged index returns assume reinvestment of any and all distributions and do not reflect our fees or expenses.
- Bloomberg Commodity Index is calculated on an excess return basis and reflects commodity futures price movements. The index rebalances annually weighted 2/3 by trading volume and 1/3 by world production and weight-caps are applied at the commodity, sector and group level for diversification.
- Bloomberg U.S. Aggregate Index covers the U.S. investment grade fixed rate bond market, with index components for government and corporate securities, mortgage pass-through securities, and asset-backed securities.
- Bloomberg U.S. Corporate High Yield Index covers the universe of fixed rate, non-investment grade debt. Eurobonds and debt issues from countries designated as emerging markets (sovereign rating of Baa1/BBB+/BBB+ and below using the middle of Moody’s, S&P, and Fitch) are excluded, but Canadian and global bonds (SEC registered) of issuers in non-EMG countries are included.
- Consumer Price Index (CPI) is a measure of the average change over time in the prices paid by urban consumers for a market basket of consumer goods and services.
- FTSE (Financial Times Stock Exchange) NAREIT Equity REITs Index contains all Equity REITs not designed as Timber REITs or Infrastructure REITs.
- MSCI EAFE (Morgan Stanley Capital International Europe, Australasia, and the Far East) is an equity index which captures large and mid-cap representation across Developed Markets countries around the world, excluding the U.S. and Canada. The index covers approximately 85% of the free float-adjusted market capitalization in each country.
- MSCI (Morgan Stanley Capital International) Emerging Markets captures large and mid-cap representation across Emerging Markets countries. The index covers approximately 85% of the free-float adjusted market capitalization in each country.
- MSCI (Morgan Stanley Capital International) China® Index captures large and mid-cap representation across China A shares, H shares, B shares, Red chips, P chips and foreign listings (e.g. ADRs). With 717 constituents, the index covers about 85% of this China equity universe.
- Russell 2000 consists of the 2,000 smallest U.S. companies in the Russell 3000 index.
- S&P 500 is a capitalization-weighted index designed to measure performance of the broad domestic economy through changes in the aggregate market value of 500 stocks representing all major industries.
- S. Dollar Index – known as USDX, DXY, DX and USD Index – is a measure of the value of the United States Dollar (USD) against a weighted basket of currencies used by U.S. trade partners. The index will rise if the Dollar strengthens against these currencies and fall if it weakens.
- The Bureau of Economic Analysis (BEA) is an agency of the Department of Commerce that produces economic accounts statistics that enable government and business decision-makers, researchers, and the American public to follow and understand the performance of the nation’s economy. To do this, BEA collects source data, conducts research and analysis, develops and implements estimation methodologies, and disseminates statistics to the public.
- The Federal Open Market Committee (FOMC) is the branch of the Federal Reserve System that determines the direction of monetary policy.
- FRED (Federal Reserve Economic Data) is an online database consisting of hundreds of thousands of economic data time series from scores of national, international, public, and private sources.
- CME FedWatch Tool, is a tool created by the CME Group (Chicago Mercantile Exchange Group) to act as a barometer for the market’s expectation of potential changes to the fed funds target rate while assessing potential Fed movements around Federal Open Market Committee (FOMC) meetings.
The material presented includes information and opinions provided by a party not related to Thrivent Advisor Network. It has been obtained from sources deemed reliable; but no independent verification has been made, nor is its accuracy or completeness guaranteed. The opinions expressed may not necessarily represent those of Thrivent Advisor Network or its affiliates. They are provided solely for information purposes and are not to be construed as solicitations or offers to buy or sell any products, securities, or services. They also do not include all fees or expenses that may be incurred by investing in specific products. Past performance is no guarantee of future results. Investments will fluctuate and when redeemed may be worth more or less than when originally invested. You cannot invest directly in an index. The opinions expressed are subject to change as subsequent conditions vary. Thrivent Advisor Network and its affiliates accept no liability for loss or damage of any kind arising from the use of this information.
This communication may include forward looking statements. Specific forward-looking statements can be identified by the fact that they do not relate strictly to historical or current facts and include, without limitation, words such as “may,” “will,” “expects,” “believes,” “anticipates,” “plans,” “estimates,” “projects,” “targets,” “forecasts,” “seeks,” “could’” or the negative of such terms or other variations on such terms or comparable terminology. These statements are not guarantees of future performance and involve risks, uncertainties, assumptions and other factors that are difficult to predict and that could cause actual results to differ materially.
Investment advisory services offered through Thrivent Advisor Network, LLC., (herein referred to as “Thrivent”), a registered investment adviser. Clients will separately engage an unaffiliated broker-dealer or custodian to safeguard their investment advisory assets. Review the Thrivent Advisor Network Financial Planning and Consulting Services, Investment Management Services (Non-Wrap) and Wrap-Fee Program brochures (Form ADV Part 2A and 2A Appendix 1 brochures) for a full description of services, fees and expenses, available at Thriventadvisornetwork.com. Thrivent Advisor Network, LLC financial advisors may also be registered representatives of a broker-dealer to offer securities products.
Certain Thrivent Advisor Network LLC advisors may also be registered representatives of a broker-dealer to offer securities products. Advisory Persons of Thrivent provide advisory services under a “doing business as” name or may have their own legal business entities. However, advisory services are engaged exclusively through Thrivent Advisor Network, LLC, a registered investment adviser. Please visit our website www.thriventadvisornetwork.com for important disclosures.
Advisory Persons of Thrivent provide advisory services under a “doing business as” name or may have their own legal business entities. However, advisory services are engaged exclusively through Thrivent Advisor Network, LLC, a registered investment adviser. Cedar Cove Wealth Partners and Thrivent Advisor Network, LLC are not affiliated companies. Information in this message is for the intended recipient[s] only. Please visit our website www.cedarcovewealth.com for important disclosures.
Securities offered through Purshe Kaplan Sterling Investments (“PKS”), Member FINRA/SIPC. PKS is headquartered at 80 State Street, Albany, NY 12207. PKS and Cedar Cove Wealth Partners are not affiliated companies.
