
A firm stance on fighting inflation from Jackson Hole pushed markets lower as investors wrestle with the impact on the global economy.
Key Observations
- Markets turned negative for the month following the Jackson Hole Economic Symposium.
- The Federal Reserve reiterated its commitment to combat inflation “until the job is done.”
- We expect market volatility to persist as we head into the end of the year, as central banks continue to fight high inflation around the world at the expense of economic growth.
Market Recap
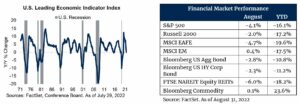
For much of August, markets were heating up in the wake of a relatively favorable earnings season. But much like a child’s summer ends with a new school year, the August rally ended following the Jackson Hole Economic Symposium in the second to last week of the month. Federal Reserve Chairman Powell said “we (the Fed) will keep at it until the job is done” followed by his view that bringing inflation down will “require a sustained period of below-trend growth” (1). These comments spooked markets and all but ended the market narrative of a pause in rising interest rates. The perceived increase in the likelihood of a recession resulting from Powell’s comments drove equity markets lower in the last two weeks of the month. Leading indicators are flashing warning signs as well. The U.S. Treasury curve remains inverted, and the Conference Board’s LEI Index (Leading Economic Index) was flat year-over-year for the most recent July reading – historically, the index has crossed into negative territory preceding a recession, but there have been “false positives” as well. Despite market concerns and the recent down draft in equities, we have seen recent economic data remain positive. Consumer confidence in August rose compared to July and ISM data indicates both the manufacturing and services sectors remain in expansion territory, albeit at a slowing rate.
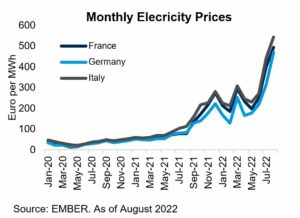
International markets were not immune to the sell-off in August. Like the Fed, the ECB has indicated its willingness to fight inflation, which will ultimately have an impact on growth in Europe. Furthermore, the conflict between Russia and Ukraine has created uncertainty as to the availability of natural gas to European nations given that Russia is the primary supplier. This has driven natural gas prices sky high this year, and electricity prices for consumers have followed suit as Europe generates approximately 13 percent of its electricity from gas (2). Electricity prices have doubled in recent months for many of the major European countries, which will likely impact consumer behavior. There has been a concerted effort to switch to other energy sources to generate electricity (coal, nuclear, liquid natural gas), but there is both a time and monetary cost to making these types of changes. Currency moves were also a headwind for U.S. based investors holding international assets, as the U.S. dollar continued to strengthen against many major currencies in August.
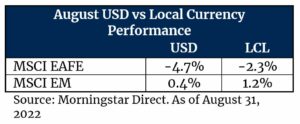
Relative to domestic and international developed markets, emerging markets fared well in August, managing to eke out a marginal gain. Notable strength from Brazil was a key contributor (MSCI Brazil returned 6.4 percent in August). Strong commodity markets, a firming labor market and better than expected economic activity provided a tailwind for the country.
Fixed income markets saw negative results likely due to the wake of higher interest rates. The U.S. 10-year Treasury yield ended the month at 3.1 percent, roughly 50 bps higher than where it began. High Yield held up slightly better than the broad Bloomberg U.S. Aggregate Index, benefiting from higher coupons to help offset the negative price impact from rising interest rates. A reduced supply environment was also beneficial, and corporate credit spreads ended the month roughly where they began. As mentioned above, the U.S. yield curve remains inverted as the Fed continues its tightening path, pushing short-term rates higher, while long-term rates remain anchored due to investor concerns about future economic growth.
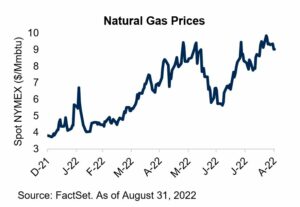
Commodity markets were one of the few bright spots for the month. The energy and agriculture segments produced strong performance, while industrial metals lagged. Energy prices remain resilient, with notable appreciation in the natural gas market stemming from the uncertainty of supply coming from Russia. Drought conditions through the summer led to weak harvests which has put upward pressure on agriculture prices. Industrial metals faltered as investors grew increasingly concerned about the potential for slower economic growth around the world.
Outlook
Investors continue to face uncertainty as we head into the fall months. All eyes are on the impact of the Fed’s commitment to fight inflation, even at the expense of the labor market and economic growth, and the September policy meeting will be watched with bated breath. Whether or not inflation has peaked remains unknown, but data suggests the worst may be behind us. There are signs of supply chain pressures easing. For example, the Baltic Dry Index, which measures the cost of shipping raw materials, has declined to levels not seen since the middle of 2020 (3). That said, we are likely to continue to experience inflation levels above the Fed’s two percent target for some time and recession watchers will likely be keeping a keen eye on a moderating economy. As we highlighted in our Midyear Capital Markets Update, corrections and recessions, while often uncomfortable, are not abnormal. Maintaining a disciplined and long-term approach to investing, in our view, affords the best opportunity to achieve one’s long-term investment objectives.
As always, should you have additional questions, please reach out to any of the professionals at Cedar Cove Wealth Partners.
Endnotes
- The Federal Reserve System: Monetary Policy and Price Stability
- EMBER
- As of August 30,2022
Disclosures and Definitions
Index Benchmarks presented within this report may not reflect factors relevant for your portfolio or your unique risks, goals or investment objectives. Past performance of an index is not an indication or guarantee of future results. It is not possible to invest directly in an index.
- The Standard & Poor’s 500 (S&P 500) is a market-cap weighted index comprised of the common stocks of 500 leading companies in leading industries of the U.S. economy.
- The Russell 2000 consists of the 2,000 smallest U.S. companies in the Russell 3000 Index.
- MSCI EAFE is an equity index which captures large and mid-cap representation across developed Markets countries around the world, excluding the U.S. and Canada. The index covers approximately 85% of the free float-adjusted market capitalization in each country.
- MSCI Emerging Markets captures large and mid-cap representation across Emerging Markets countries. The index covers approximately 85% of the free float adjusted market capitalization in each country.
- Bloomberg U.S. Aggregate Index covers the U.S. investment grade fixed rate bond market, with index components for government and corporate securities, mortgage pass-through securities, and asset-backed securities.
- Bloomberg U.S. Corporate High Yield Index covers the universe of fixed rate, non-investment grade debt. Eurobonds and debt issues from countries designated as emerging markets (sovereign rating of Baa1/BBB+/BBB+ and below using the middle of Moody’s, S&P, and Fitch) are excluded, but Canadian and global bonds (SEC registered) of issuers in non-EMG countries are included.
- FTSE NAREIT Equity REITs Index contains all Equity REITs not designed as Timber REITs or Infrastructure REITs.
- Bloomberg Commodity Index is calculated on an excess return basis and reflects commodity futures price movements. The index rebalances annually weighted 2/3 by trading volume and 1/3 by world production and weight-caps are applied at the commodity, sector and group level for diversification.
- The Baltic Dry Index (BDI) is a shipping freight-cost index issued daily by the London-based Baltic Exchange. The BDI is a composite of the Capesize, Panamax and Supramax Timecharter Averages. It is reported around the world as a proxy for dry bulk shipping stocks as well as a general shipping market bellwether.
- The MSCI (Morgan Stanley Capital International) Brazil Index is designed to measure the performance of the large and mid-cap segments of the Brazilian market. With 50 constituents, the index covers about 85% of the Brazilian equity universe.
- Institute for Supply Management (ISM) purchasing managers’ index (PMI), is a monthly indicator of U.S. economic activity based on a survey of purchasing managers at more than 300 manufacturing firms. It is considered to be a key indicator of the state of the U.S. economy.
- The Leading Economic Index (LEI) is an index published monthly by The Conference Board. It is used to predict the direction of global economic movements in future months. The index is composed of 10 economic components whose changes tend to precede changes in the overall economy.
Investment advisory services offered through Thrivent Advisor Network, LLC., a registered investment adviser and a subsidiary of Thrivent. Advisory Persons of Thrivent provide advisory services under a “doing business as” name or may have their own legal business entities. However, advisory services are engaged exclusively through Thrivent Advisor Network, LLC, a registered investment adviser. Cedar Cove Wealth Partners and Thrivent Advisor Network, LLC are not affiliated companies. Information in this message is for the intended recipient[s] only. Please visit our website www.cedarcovewealth.com for important disclosures.
The material presented includes information and opinions provided by a party not related to Thrivent Advisor Network. It has been obtained from sources deemed reliable; but no independent verification has been made, nor is its accuracy or completeness guaranteed. The opinions expressed may not necessarily represent those of Thrivent Advisor Network or its affiliates. They are provided solely for information purposes and are not to be construed as solicitations or offers to buy or sell any products, securities, or services. They also do not include all fees or expenses that may be incurred by investing in specific products. Past performance is no guarantee of future results. Investments will fluctuate and when redeemed may be worth more or less than when originally invested. You cannot invest directly in an index. The opinions expressed are subject to change as subsequent conditions vary. Thrivent Advisor Network and its affiliates accept no liability for loss or damage of any kind arising from the use of this information.
This communication may include forward looking statements. Specific forward-looking statements can be identified by the fact that they do not relate strictly to historical or current facts and include, without limitation, words such as “may,” “will,” “expects,” “believes,” “anticipates,” “plans,” “estimates,” “projects,” “targets,” “forecasts,” “seeks,” “could’” or the negative of such terms or other variations on such terms or comparable terminology. These statements are not guarantees of future performance and involve risks, uncertainties, assumptions and other factors that are difficult to predict and that could cause actual results to differ materially.
Different types of investments involve varying degrees of risk. Therefore, it should not be assumed that future performance of any specific investment or investment strategy will be profitable.
The European Central Bank (ECB) is the central bank of the 19 European Union countries which have adopted the euro. Its main task is to maintain price stability. It is the prime component of the Eurosystem and the European System of Central Banks (ESCB) as well as one of seven institutions of the European Union.
