
Mayday?
The probability of an economic slowdown has risen, but we believe growth will remain positive
May 2022
Key Observations
- A late May rally pushed equity markets into modestly positive territory for the month.
- Fixed income investors saw some reprieve as interest rates moved off recent high levels amid concerns of weaker expectations for economic growth in the back half of the year.
- Growing concerns of a global economic slowdown are materializing as investors wait to see if the Fed will have to tip the economy into recession to get inflation under control: we expect elevated market volatility to persist.
Market Recap
On the surface, market returns in May appeared to be uneventful and were modestly positive. However, the reality within the month was far from that. For much of May, equity markets largely fell as investor focus turned to whether the Federal Reserve actions to suppress inflation could lead to recession. However, favorable consumer spending data, a “buy-the-dip” mentality, flows into equities, and talks of a potential “Fed pause” in September led to a rally at the end of the month, reversing the market trend. Many major indexes ultimately posted modest positive returns for the month. Despite the positive May result, many asset classes remain negative year-to-date and in correction territory (down 10 percent or more) as persistently high inflation, tightening monetary policy globally and continued supply chain issues weigh on sentiment. Real estate(1) came under pressure in May following worse than expected housing starts data and fear that higher mortgage rates will cool the residential housing market.
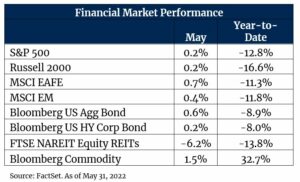
Amid growing concerns for an economic slowdown, the fixed income markets resumed their more typical pattern and prices increased as interest rates fell from recent highs and the Bloomberg U.S. Aggregate Bond Index returned 0.6 percent for the month. As expected, the Federal Reserve raised their target rate by 0.50 percent, now targeting 0.75-1 percent(2) and the market is all but pricing in another 50 basis point hike in June. The U.S. 10-year Treasury yield ended the month at 2.8 percent, modestly lower than where it began, but well off the intramonth high of 3.1 percent(3).
The corporate high yield market eked out a modest gain following the risk on sentiment the last week of the month with the Bloomberg U.S. Corporate High Yield Index returning 0.2 percent. The persisting conflict between Ukraine and Russia continues to impact global commodity markets. European Union leaders are in discussions to further limit Russian oil exports to the continent, sending oil prices higher. Brent crude crossed $120 barrel for the first time since March(4), sending the Bloomberg Commodity Index up 1.5 percent for the month.
A Shift in Market Sentiment
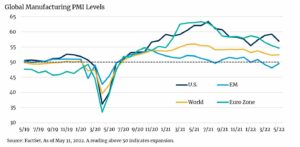
Market sentiment shifted during May with growing concern of an economic slowdown as the Federal Reserve continues to tighten policy to combat persistently high inflation. Despite favorable corporate fundamentals, over 77 percent of companies in the S&P 500 have reported positive earnings surprises in the first quarter according to FactSet(5). Expectations for earnings growth in the second half of the year remain high but negative guidance has been growing as wage pressures and supply chain issues impact both top and bottom-line results. On top of that, we are beginning to see economic data, while still positive, trend off recent peaks.
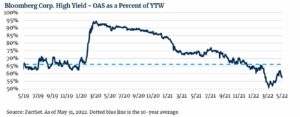
The yield on corporate bonds is a general gauge of risk appetite of investors. Looking under the hood at the composition of the yield is often a more telling story. The total yield on a corporate bond is comprised of the risk-free rate and the credit risk – or default risk – of the issuer. This default risk is often referred to as the “spread” above Treasuries or Option Adjusted Spread (“OAS”). Yields have moved broadly higher this year but, early on, much of that movement was driven by higher interest rates rather than concerns about credit worthiness. In more recent months OAS has crept higher as a percentage of overall yield, an indication that investors are showing increased concern. Despite the greater share of yield, levels remain below the 10-year average and well below the level at the onset of the pandemic in March 2020.
Outlook
It has been a roller coaster ride thus far in 2022 and current conditions suggest the potential for volatility to continue through the year. Slowing economic growth, high expectations for earnings, tightening monetary conditions and a difficult labor market may continue to play a role in the months to come. In periods of volatility, similar to what we are currently experiencing, the likelihood of making emotional and potentially detrimental decisions is rising. We continue to advocate for adhering to a long-term and disciplined approach to investing.
As always, should you have additional questions, please reach out to any of the professionals at Cedar Cove Wealth Partners.
Footnotes
- FTSE NAREIT Equity REITs Index
- Federal Reserve, as of May 4, 2022
- FactSet, as of May 31, 2022
- FactSet, as of May 31, 2022
- FactSet Earnings Insight, as of May 27, 2022
Disclosures and Definitions
Index Benchmarks presented within this report may not reflect factors relevant for your portfolio or your unique risks, goals or investment objectives. Past performance of an index is not an indication or guarantee of future results. It is not possible to invest directly in an index.
- The S&P 500 is a capitalization-weighted index designed to measure performance of the broad domestic economy through changes in the aggregate market value of 500 stocks representing all major industries.
- Russell 2000 consists of the 2,000 smallest U.S. companies in the Russell 3000 index.
- MSCI EAFE (Morgan Stanley Capital International Europe, Australasia, and the Far East) is an equity index which captures large and mid-cap representation across Developed Markets countries around the world, excluding the U.S. and Canada. The index covers approximately 85% of the free float-adjusted market capitalization in each country.
- MSCI (Morgan Stanley Capital International) Emerging Markets captures large and mid-cap representation across Emerging Markets countries. The index covers approximately 85% of the free-float adjusted market capitalization in each country.
- The Bloomberg U.S. Aggregate index covers the U.S. investment grade fixed rate bond market, with index components for government and corporate securities, mortgage pass-through securities, and asset-backed securities.
- Bloomberg Commodity Index is calculated on an excess return basis and reflects commodity futures price movements. The index rebalances annually weighted 2/3 by trading volume and 1/3 by world production and weight-caps are applied at the commodity, sector and group level for diversification.
- FTSE Nareit Equity REITs Index contains all Equity REITs not designed as Timber REITs or Infrastructure REITs. It is a free-float adjusted, market capitalization-weighted index of U.S. equity REITs. Constituents of the index include all tax-qualified REITs with more than 50 percent of total assets in qualifying real estate assets other than mortgages secured by real property.
- Bloomberg U.S. Corporate High Yield Index covers the universe of fixed rate, non-investment grade debt. Eurobonds and debt issues from countries designated as emerging markets (sovereign rating of Baa1/BBB+/BBB+ and below using the middle of Moody’s, S&P, and Fitch) are excluded, but Canadian and global bonds (SEC registered) of issuers in non-EMG countries are included.
- The Global Manufacturing PMI (Purchasing Managers’ Index) is the earliest indicator of Global economic and business conditions, produced on a monthly basis ~ released at the start of every month with data relating to the month just passed. It has a strong track record of accurately anticipating global GDP data.
Advisory Persons of Thrivent provide advisory services under a practice name or “doing business as” name or may have their own legal business entities. However, advisory services are engaged exclusively through Thrivent Advisor Network, LLC, a registered investment adviser.
The material presented includes information and opinions provided by a party not related to Thrivent Advisor Network. It has been obtained from sources deemed reliable; but no independent verification has been made, nor is its accuracy or completeness guaranteed. The opinions expressed may not necessarily represent those of Thrivent Advisor Network or its affiliates. They are provided solely for information purposes and are not to be construed as solicitations or offers to buy or sell any products, securities or services. They also do not include all fees or expenses that may be incurred by investing in specific products. Past performance is no guarantee of future results. Investments will fluctuate and when redeemed may be worth more or less than when originally invested. You cannot invest directly in an index. The opinions expressed are subject to change as subsequent conditions vary. Thrivent Advisor Network and its affiliates accept no liability for loss or damage of any kind arising from the use of this information.
Different types of investments involve varying degrees of risk. Therefore, it should not be assumed that future performance of any specific investment or investment strategy will be profitable.
THRIVENT IS THE MARKETING NAME FOR THRIVENT FINANIAL FOR LUTHERANS. Investment advisory services offered through Thrivent Advisor Network, LLC., a registered investment adviser and a subsidiary of Thrivent.
