
After rising for seven consecutive months, broad measures of US large cap equity markets took a tumble in September as economic activity slowed and a myriad of inflation measures continued to rise, exceeding the loosely defined definition of transitory. Given what can only be termed an impressive second quarter earnings season (YoY growth of 87%) that drove prices higher through August, the sell-off started from lofty levels, leaving investors only mildly scathed as the quarter ended.
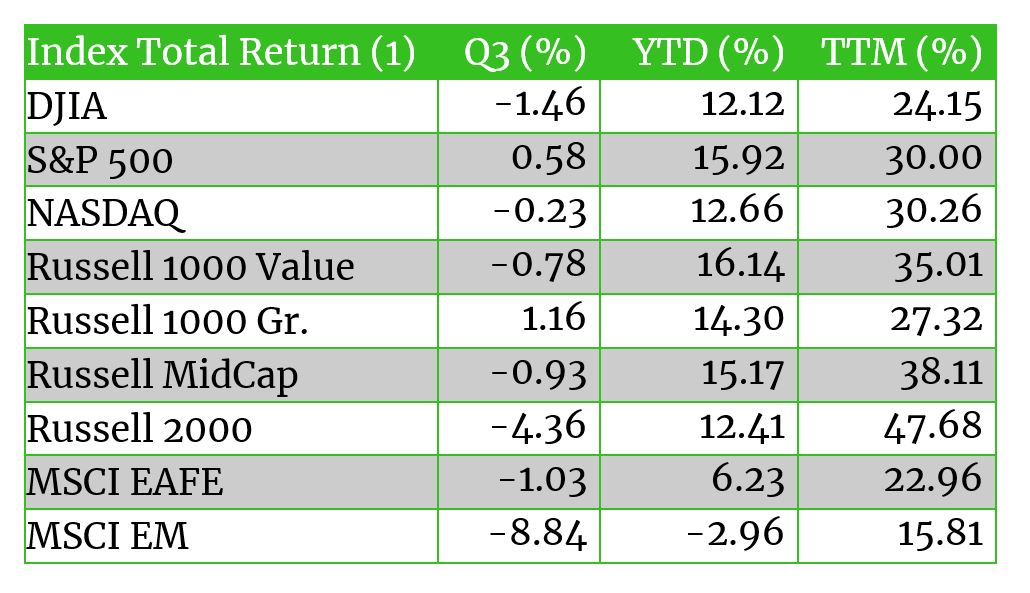
For the three months ending in September, large caps (2) outperformed small caps by almost 5%, though small caps retained more than a 17% advantage over the trailing twelve months. Unlike the second quarter when earnings momentum lifted all but one sector (3), defensive sectors proved the most resilient with utilities and healthcare finishing among the top three, bested only by financials whose outlooked brightened on the back of improving net interest margins and shrinking loan loss reserves. Energy ended down almost 2% despite WTI crude prices rising almost 10% for the quarter. Fundamentals for demand continued to improve as the global economy moved closer to “normal”, but a growing awareness for climate change risks, a rising cost of capital, and the transition to clean-energy have, at least for the time being, placed a cap on energy valuations.
Supply chain constraints hindering trade and manufacturing, inflationary pressures, and expectations for monetary policy to gradually tighten left developed country returns mixed, but overall resulted in the MSCI EAFE falling -1.03% for the quarter. The real damage to investors was felt in emerging markets where a quiver of regulatory arrows was unleashed across China, limiting the profitability of technology, education, gaming, and other key sectors as the Chinese Communist Party emphasized its goal of delivering common prosperity. Stock prices plunged more than 18% in China (4), and at more than 33% of the MSCI EM index’s weight, left the broader measure down -8.8% for the quarter.
As price data was published throughout September, central bankers began to adjust their views on inflation, marking a key shift that its anticipated transitory nature was persisting longer than had been previously expected. In response, fixed income investors repriced inflation expectations higher and pulled forward the timing of when monetary conditions would begin to tighten.
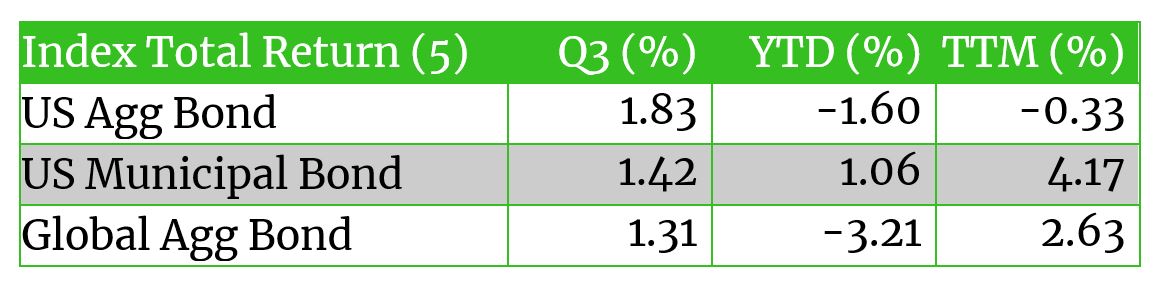
With the impact and likelihood of pending fiscal stimulus from two possible infrastructure bills stuck in muddled negotiations, a potential offset to tighter monetary conditions, the benchmark 10-year Treasury yield rose 20 bps in the last two weeks of trading, which left the Bloomberg US Aggregate Index clipping coupons to finish flat (+0.05%), while the Bloomberg Global Aggregate Index fell -0.88%.
Year-end Capital Market Considerations
COVID’s persistence, supply chain kinks, labor shortages, price pressures ready to boil over, and policy shifts on the horizon
With just two months remaining in the year, investors are beginning to update their expectations for return assumptions coming out of a historic period of monetary and fiscal support. As capital market assumptions are revised, elevated valuations and rising inflation are set to weigh on near-term return across both bonds and equities. While real assets remain a key hedge and diversifier, they are not immune from systematic risks. The challenge for investors, central bankers, and politicians alike, is assessing what tools and policies can best be applied to address the challenges that lie ahead while reducing the odds of making a policy misstep along the way. While we diligently work through this process, the observations below are what we consider important and defining trends for investors to consider.
Key Observations & Trends
- Volatility re-emerged in September, but the near 5% decline fell well short of the 40-year intra-year average of 14.3% (6). Heading into the fourth quarter volatility could be triggered by a number of factors, such as Fed tapering, renewed debate over the debt ceiling in early December, and fiscal spending developments tied to the proposed social and physical infrastructure bills. Energy shortages across the UK, Europe and in China, as well as diplomatic tensions between China and the US are also worth monitoring.
- Depending on where you live, it’s possible to forget that the world, including America, remain mired in a pandemic, . Failure to manage the virus increases the potential risk of future mutations and the economic and human costs born as the world transitions from pandemic to endemic.
- Supply chains and labor markets are being strained by factors unique to the pandemic. The combination of unanticipated and heightened demand, largely from US consumers, and fragile just-in-time global networks has pushed prices and wages higher. While supply chain strains should gradually ease as markets naturally rebalance, heightened levels of inflation, changing consumer behaviors, and the growing power of labor increase the risks of a potential policy mistake.
- Markets have adapted to unusual levels of fiscal and monetary support. As the economy stabilizes and growth resumes its long-term trends, the gradual and effective reduction in policy support should allow long-term fundamental drivers of performance to resume their traditional roles.
Portfolio Opportunities & Considerations
- As China becomes increasingly self-sufficient, its contribution to global growth is likely to slow as net exports fall. Faced with demographic headwinds, investor demand to reduce leverage (Evergrande the latest reason), and a global call to reduce carbon emissions the country faces a number of challenges that carry both domestic and global implications. Despite these challenges, the effectiveness of the CCP at reducing poverty while maintaining the delicate balance between private capital markets and one-party rule are undeniable. Given the size of China’s economy and investment market, separating it from other emerging countries could add value and improve diversification.
- The interest in Environment, Social, and Governance (ESG) factors continues to accelerate with the environment taking center stage given the lack of a planet B. Recent energy shortages in the UK, EU, and China reaffirms the need to thoughtfully transition to renewable energy sources but clouds the role of global oil majors as we do so. While transitioning to net-zero emissions remains critical based on the science, there is growing recognition among investors that the transition represents a capital deployment event of historic proportions. Like the foundation created by the internet, the basis of the world’s largest companies, energy and carbon innovations are positioned to offer similar opportunities for investors. Investors who acknowledge this opportunity are best positioned to benefit from it and manage the risk to traditional investments.
For more information, please reach out to any of the professionals at Cedar Cove Wealth Partners.
Footnotes
- All referenced indexes in the table below are shown on a total return basis. For example, “DJIA” represents the Dow Jones Industrial Average Total Return Index. Q3 returns are for the period from 7/1/2021-9/30/2021; year-to-date (YTD) returns are from 1/1/2021-9/30/2021, and trailing twelve months (TTM) returns are from 10/1/2020-9/30/2021; Data source: Morningstar.
- Large cap refer to the S&P 500 TR Return index while small caps refers to the Russell 2000 index.
- Sector references refer to the eleven defined sectors of the S&P 500 as defined and measure by Standard & Poors. Return references follow the same time periods detailed in the tables.
- MSCI China Price Return Index July 1 – September 30, 2021
- The fixed income indexes referenced below are for the Bloomberg US Aggregate Total Return, Bloomberg Municipal Total Return, and Bloomberg Global Aggregate TR USD indexes. Q3 returns are for the period from 7/1/2021-9/30/2021; year-to-date (YTD) returns are from 1/1/2021 – 9/30/2021, and trailing twelve months (TTM) returns are from 10/1/2020-9/30/2021. Data source: Morningstar.
- FactSet, Standard & Poor’s, J.P. Morgan Asset Management. Returns are based on the S&P 500 price index from 1980 to 2020 and do not include dividends. Intra-year drops are calculated as the largest market drops from a peak to a trough during the year. Over this time period the average annual return was 9.0% for the S&P 500 Price Index. 2021 intra-year price declines as of September 30, 2021
Advisory Persons of Thrivent provide advisory services under a practice name or “doing business as” name or may have their own legal business entities. However, advisory services are engaged exclusively through Thrivent Advisor Network, LLC, a registered investment adviser.
The material presented includes information and opinions provided by a party not related to Thrivent Advisor Network. It has been obtained from sources deemed reliable; but no independent verification has been made, nor is its accuracy or completeness guaranteed. The opinions expressed may not necessarily represent those of Thrivent Advisor Network or its affiliates. They are provided solely for information purposes and are not to be construed as solicitations or offers to buy or sell any products, securities or services. They also do not include all fees or expenses that may be incurred by investing in specific products. Past performance is no guarantee of future results. Investments will fluctuate and when redeemed may be worth more or less than when originally invested. You cannot invest directly in an index. The opinions expressed are subject to change as subsequent conditions vary. Thrivent Advisor Network and its affiliates accept no liability for loss or damage of any kind arising from the use of this information.
Different types of investments involve varying degrees of risk. Therefore, it should not be assumed that future performance of any specific investment or investment strategy will be profitable.
THRIVENT IS THE MARKETING NAME FOR THRIVENT FINANIAL FOR LUTHERANS. Investment advisory services offered through Thrivent Advisor Network, LLC., a registered investment adviser and a subsidiary of Thrivent.
Index Benchmarks presented within this report may not reflect factors relevant for your portfolio or your unique risks, goals or investment objectives. Past performance of an index is not an indication or guarantee of future results. It is not possible to invest directly in an index.
The Bloomberg Barclays Aggregate Bond® Index, or “Agg” (for aggregate), is a broad-based fixed-income index used by bond traders, mutual funds, and ETFs as a benchmark to measure their relative performance.
The Bloomberg Barclays Global Aggregate® Index is a flagship measure of global investment grade debt from twenty-four local currency markets. This multi-currency benchmark includes treasury, government-related, corporate and securitized fixed-rate bonds from both developed and emerging markets issuers.
The Bloomberg Barclays US Aggregate Bond® Index, or the Agg, is a broad base, market capitalization-weighted bond market index representing intermediate term investment grade bonds traded in the United States. Investors frequently use the index as a stand-in for measuring the performance of the US bond market.
The Dow Jones Industrial Average (DJIA), also known as the Dow 30, is a stock market index that tracks 30 large, publicly-owned blue-chip companies trading on the New York Stock Exchange (NYSE) and the NASDAQ.
The MSCI EAFE® Index is a broad market index of stocks located within countries in Europe, Australasia, and the Middle East.
The MSCI Emerging Markets® Index is a selection of stocks that is designed to track the financial performance of key companies in fast-growing nations.
The Nasdaq Composite Index is the market capitalization-weighted index of over 2,500 common equities listed on the Nasdaq stock exchange.
The Russell 1000® Index represents the top 1000 companies by market capitalization in the United States.
The Russell 1000 Growth® Index measures the performance of the Russell 1000® ‘s growth segment, which is defined to include firms whose share prices have higher price-to-book ratios and higher expected earnings growth rates.
The Russell 1000 Value® Index measures the performance of the large-cap value segment of the U.S. equity universe. It includes those Russell 1000® companies with lower price-to-book ratios and lower expected and historical growth rates.
The Russell 2000® Index measures the performance of the 2,000 smaller companies that are included in the Russell 3000® Index, which itself is made up of nearly all U.S. stocks. The Russell 2000® is widely regarded as a bellwether of the U.S. economy because of its focus on smaller companies that focus on the U.S. market.
West Texas Intermediate, WTI, is the main oil benchmark for North America as it is sourced from the United States, primarily from the Permian Basin. The oil comes mainly from Texas.
